Analysis - by Type (Vitamins, Minerals, Amino Acids, Antibiotics, Antioxidants, Blends, and Others), Form (Dry and Liquid), and Livestock (Poultry, Ruminants, Swine, Aquaculture, and Others)
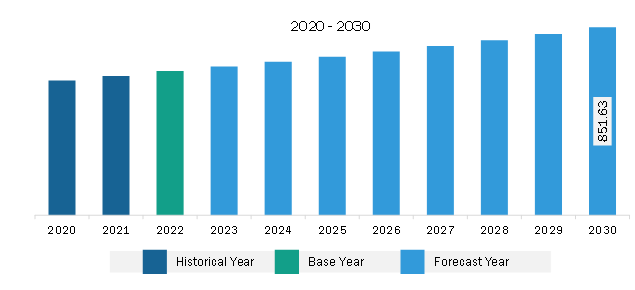
The Middle East & Africa feed premix market was valued at US$ 653.50 million in 2022 and is expected to reach US$ 851.63 million by 2030; it is estimated to grow at a CAGR of 3.4% from 2022 to 2030.
Increase in Livestock Production Bolsters Middle East & Africa Feed Premix Market
Industrial livestock production has undergone a significant transformation owing to increasing demand for meat-based products and dairy products. Animal protein account for 16% of energy and 34% of the protein in human diets. Livestock production also accounts for ~19% of the value of food production and 30% of the global value of agriculture. The demand for livestock products is driven by changing lifestyles and food preferences, increasing urbanization, growing income, and the rapidly rising world population. With burgeoning livestock demand, the consumption of protein-rich meat products is surging. According to the Food and Agriculture Organization (FAO), worldwide meat protein consumption is predicted to increase by 14% by 2030. Additionally, world milk production is expected to rise by 1.6% annually between 2020 and 2029 and reach 997 million metric tons in 2029, according to a report by the Organization for Economic Co-operation and Development (OECD) and FAO. Thus, the increasing consumption of livestock products such as meat and increasing milk production has encouraged manufacturers to focus on providing good quality and nutrient rich feed for livestock. This drives the demand for feed premix as an additive among the feed manufacturers. The growth in livestock production is likely to create a demand for feed premixes to enhance the nutritional quality of feed, as people are highly concerned about the quality of meat they consume. Nutrient deficiencies in livestock can be resolved by providing them with nutritional feed that maintains the growth rate of livestock, their health, and well-being. Thus, with the surging demand, the production of healthy livestock is increasing across the globe, further driving the Middle East & Africa feed premix market.
Middle East & Africa Feed Premix Market Overview
The increasing demand for quality meat products in the Middle East & Africa is increasing the adoption of animal feed among livestock farms, boosting the demand for feed additives such as feed premixes. As per the report of Alltech Global, South Africa, Oman, Egypt, Nigeria, Morocco, and Algeria are cumulatively producing 65% of animal feed in the Middle East & Africa. Furthermore, South Africa, Tanzania, Kenya, and Ethiopia are leading livestock farming nations in the region. Thus, increased livestock farming surged the demand for animal feed, boosting the Middle East & Africa feed premix market. Southern African Development Community (SADC) is also promoting regional livestock programs to address difficulties and challenges faced by the livestock sector in the SADC countries. These projects received support from International Cooperating Partners and the Livestock Technical Committee (LTC). Hence, the rising demand for meat products across the region fosters livestock farming activities, mostly in African countries, and subsequently increases the demand for animal feed additives such as feed premix. Therefore, the Middle East & Africa feed premix market in the region is expected to witness significant growth during the forecast period.
Middle East & Africa Feed Premix Market Revenue and Forecast to 2030 (US$ Million)
Middle East & Africa Feed Premix Market Segmentation
The Middle East & Africa feed premix market is segmented based on type, form, livestock, and country.
Based on type, the Middle East & Africa feed premix market is segmented into vitamins, minerals, amino acids, antibiotics, antioxidants, blends, and others. The blends segment held the largest share in 2022.
By form, the Middle East & Africa feed premix market is bifurcated into dry and liquid. The dry segment held a larger share in 2022.
By livestock, the Middle East & Africa feed premix market is categorized into research poultry, ruminants, swine, aquaculture, and others. The poultry segment held the largest share in 2022.
Based on country, the Middle East & Africa feed premix market is segmented into South Africa, Saudi Arabia, the UAE, and the Rest of Middle East & Africa. The Rest of Middle East & Africa dominated the Middle East & Africa feed premix market in 2022.
Archer-Daniels-Midland Co, Cargill Inc, De Heus Voeders BV, Kemin Industries Inc, Koninklijke DSM NV, and Nutreco NV are some of the leading companies operating in the Middle East & Africa feed premix market.
Middle East & Africa Feed Premix Market Strategic Insights
Get more information on this report
Middle East & Africa Feed Premix Market Segmentation Analysis
Middle East & Africa Feed Premix Market Report Highlights
Middle East & Africa Feed Premix Report Scope
Report Attribute
Details
Market size in 2022
US$ 653.50 Million
Market Size by 2030
US$ 851.63 Million
CAGR (2022 - 2030)
3.4%
Historical Data
2020-2021
Forecast period
2023-2030
Segments Covered
By Type
Vitamins
Minerals
Amino Acids
Antibiotics
Antioxidants
Blends
By Form
Dry
Liquid
By Livestock
Poultry
Ruminants
Swine
Aquaculture
Regions and Countries Covered
Middle East and Africa
South Africa, Saudi Arabia, UAE, Rest of Middle East and Africa
Market leaders and key company profiles
Archer-Daniels-Midland Co
Cargill Inc
De Heus Voeders BV
Kemin Industries Inc
Koninklijke DSM NV
Nutreco NV
Get more information on this report
Middle East & Africa Feed Premix Market Country and Regional Insights
Get more information on this report
Identical Market Reports with other Region/Countries
The List of Companies - Middle East & Africa Feed Premix Market
1. Archer-Daniels-Midland Co 2. Cargill Inc3. De Heus Voeders BV4. Kemin Industries Inc5. Koninklijke DSM NV6. Nutreco NV
Frequently Asked Questions
How big is the Middle East & Africa Feed Premix Market?
The Middle East & Africa Feed Premix Market is valued at US$ 653.50 Million in 2022, it is projected to reach US$ 851.63 Million by 2030.
What is the CAGR for Middle East & Africa Feed Premix Market by (2022 - 2030)?
As per our report Middle East & Africa Feed Premix Market, the market size is valued at US$ 653.50 Million in 2022, projecting it to reach US$ 851.63 Million by 2030. This translates to a CAGR of approximately 3.4% during the forecast period.
What segments are covered in this report?
The Middle East & Africa Feed Premix Market report typically cover these key segments-
Type (Vitamins, Minerals, Amino Acids, Antibiotics, Antioxidants, Blends)
What is the historic period, base year, and forecast period taken for Middle East & Africa Feed Premix Market?
The historic period, base year, and forecast period can vary slightly depending on the specific market research report. However, for the Middle East & Africa Feed Premix Market report:
Historic Period : 2020-2021
Base Year : 2022
Forecast Period : 2023-2030
Who are the major players in Middle East & Africa Feed Premix Market?
The Middle East & Africa Feed Premix Market is populated by several key players, each contributing to its growth and innovation. Some of the major players include:
Archer-Daniels-Midland Co
Cargill Inc
De Heus Voeders BV
Kemin Industries Inc
Koninklijke DSM NV
Nutreco NV
Who should buy this report?
The Middle East & Africa Feed Premix Market report is valuable for diverse stakeholders, including:
Investors: Provides insights for investment decisions pertaining to market growth, companies, or industry insights. Helps assess market attractiveness and potential returns.
Industry Players: Offers competitive intelligence, market sizing, and trend analysis to inform strategic planning, product development, and sales strategies.
Suppliers and Manufacturers: Helps understand market demand for components, materials, and services related to concerned industry.
Researchers and Consultants: Provides data and analysis for academic research, consulting projects, and market studies.
Financial Institutions: Helps assess risks and opportunities associated with financing or investing in the concerned market.
Essentially, anyone involved in or considering involvement in the Middle East & Africa Feed Premix Market value chain can benefit from the information contained in a comprehensive market report.


 Get Free Sample For Middle East & Africa Feed Premix Market


