Prognose zum europäischen Gaspipeline-Infrastrukturmarkt bis 2030 – Regionale Analyse – nach Betrieb (Übertragung und Verteilung), Ausrüstung (Pipeline, Kompressorstation, Messanlagen und andere) und Anwendung (Onshore und Offshore)
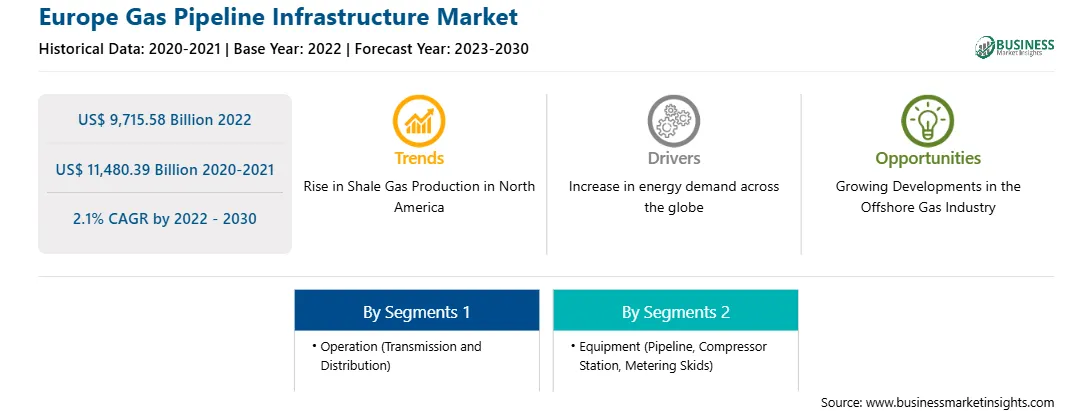
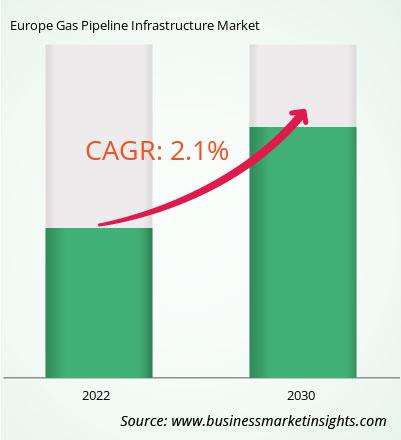
Der europäische Markt für Gaspipeline-Infrastruktur wird voraussichtlich von 9.715,58 Milliarden US-Dollar im Jahr 2022 auf 11.480,39 Milliarden US-Dollar im Jahr 2030 wachsen. Von 2022 bis 2030 wird eine durchschnittliche jährliche Wachstumsrate von 2,1 % erwartet.
Integration mit erneuerbarer Energie treibt europäischen Markt für Gaspipeline-Infrastruktur an
Bei der Integration mit erneuerbarer Energie werden Erdgaspipelines genutzt, um die intermittierende Natur erneuerbarer Quellen wie Solar- und Windenergie zu unterstützen. Diese Integration bietet Pipelinebetreibern die Möglichkeit, mit Entwicklern erneuerbarer Energien zusammenzuarbeiten und in Infrastruktur zu investieren, die die Erzeugung erneuerbarer Energien ergänzt. Beispielsweise können gasbefeuerte Kraftwerke in Zeiten geringer Produktion erneuerbarer Energien als Backup und Netzstabilität dienen und so die Abhängigkeit von fossilen Brennstoffen und Kohlenstoffemissionen verringern. Darüber hinaus ermöglichen Fortschritte bei Technologien wie Power-to-Gas die Umwandlung überschüssiger erneuerbarer Energie in Wasserstoff oder synthetisches Erdgas, das in Pipelines zur späteren Verwendung gespeichert werden kann. Durch die Integration von Erdgaspipelines in erneuerbare Energiequellen können Unternehmen zu Dekarbonisierungsbemühungen beitragen, die Energiesicherheit verbessern und den Übergang zu einem nachhaltigeren Energiesystem unterstützen.
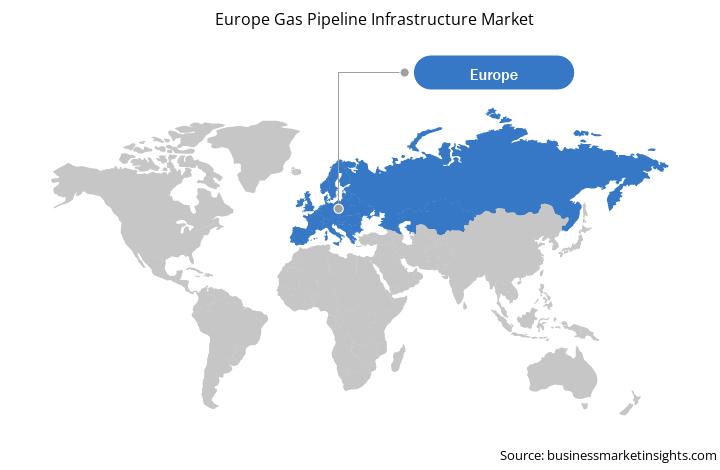
Überblick über den europäischen Markt für Gaspipeline-Infrastruktur
Russland, Deutschland, Frankreich und Spanien sind einige der wichtigsten Länder, die zum allgemeinen Wachstum des Gaspipeline-Infrastrukturmarktes in Europa beitragen. Die Regierungspolitik und -mandate im Einklang mit den Zielen für Netto-Null-Kohlenstoffemissionen und saubere Energie schaffen die Nachfrage nach nachhaltiger Infrastruktur, einschließlich Gaspipelinenetzen. In der Europäischen Union hat sich der Kohlendioxidanteil im Energiesektor im Jahr 2022 erheblich verschärft. Einige Länder haben den Betrieb von Kohlekraftwerken wieder aufgenommen, während Ausfälle von Kernkraftwerken und eine geringe Wasserkraftproduktion die Zuverlässigkeit von Erdgas stärkten. Im Einklang mit dem Pariser Abkommen, an dem 2015 196 Teilnehmer der UN-Klimakonferenz (COP21) in Paris, Frankreich, teilnahmen, etabliert die Regierung Richtlinien für Netto-Null-Emissionen und grüne Energie. Der wachsende Anteil kohlenstoffarmer Energieressourcen im Energiemix und im Industriesektor sind wichtige Antriebsfaktoren für den Gaspipeline-Infrastrukturmarkt in der Region. Die Entwicklung neuer Pipeline-Infrastrukturen und die Erweiterung der Kapazität bestehender Gaspipelines dürften im Prognosezeitraum auch das Wachstum des Gaspipeline-Infrastrukturmarktes in Europa ankurbeln. Deutschland erlebte bis Ende 2022 aufgrund der Knappheit der Gasressourcen in den Bergbaugebieten des Landes ein langsames Wachstum der Gasproduktion. Das Land ist stark auf Importe aus verschiedenen Ländern wie den USA, Italien, Großbritannien und Norwegen angewiesen. Es importiert etwa 70 % seines Energiebedarfs, da die inländische Produktion nur etwa 6 % seines Gasverbrauchs deckt. Im Jahr 2023 haben die Regierungen Deutschlands und Italiens zusammengearbeitet, um eine geplante Gaspipeline zu gründen. Die geplante Pipeline ist ein 3.300 km langes Projekt und soll vier europäische Übertragungsnetzbetreiber einbeziehen, darunter Trans Austria Gasleitung, Snam, Bayernets und Gas Connect Austria in Deutschland. Daher wird erwartet, dass der Bau der neuen Pipeline und die Instandhaltung des bestehenden Gasnetzes den Ausbau der Gaspipeline-Infrastruktur in Deutschland im Prognosezeitraum vorantreiben werden.
Umsatz und Prognose für den europäischen Gaspipeline-Infrastrukturmarkt bis 2030 (Milliarden US-Dollar)
Segmentierung des europäischen Gaspipeline-Infrastrukturmarktes
Der europäische Gaspipeline-Infrastrukturmarkt ist in Betrieb, Ausrüstung, Anwendung und Land segmentiert.
Basierend auf dem Betrieb ist der europäische Gaspipeline-Infrastrukturmarkt in Übertragung und Verteilung unterteilt. Das Verteilungssegment hatte 2022 einen größeren Anteil am europäischen Gaspipeline-Infrastrukturmarkt.
In Bezug auf die Ausrüstung ist der europäische Gaspipeline-Infrastrukturmarkt in Pipeline, Kompressorstation, Messschlitten und Ventile unterteilt. Das Pipeline-Segment hatte 2022 den größten Anteil am europäischen Gaspipeline-Infrastrukturmarkt.
Basierend auf der Anwendung ist der europäische Gaspipeline-Infrastrukturmarkt in Onshore und Offshore unterteilt. Das Onshore-Segment hielt 2022 einen größeren Anteil am europäischen Markt für Gaspipeline-Infrastruktur.
Nach Ländern ist der europäische Markt für Gaspipeline-Infrastruktur in Deutschland, Frankreich, Italien, Spanien, Russland, Großbritannien und das übrige Europa unterteilt. Das übrige Europa dominierte 2022 den europäischen Markt für Gaspipeline-Infrastruktur.
Enbridge Inc, Berkshire Hathaway Inc, Kinder Morgan Inc, Beltps, Enagas SA und Saipem SpA sind einige der führenden Unternehmen auf dem europäischen Markt für Gaspipeline-Infrastruktur.
Europe Gas Pipeline Infrastructure Strategic Insights
Strategic insights for Europe Gas Pipeline Infrastructure involve closely monitoring industry trends, consumer behaviours, and competitor actions to identify opportunities for growth. By leveraging data analytics, businesses can anticipate market shifts and make informed decisions that align with evolving customer needs. Understanding these dynamics helps companies adjust their strategies proactively, enhance customer engagement, and strengthen their competitive edge. Building strong relationships with stakeholders and staying agile in response to changes ensures long-term success in any market.
Get more information on this report
Europe Gas Pipeline Infrastructure Report Scope
Report Attribute
Details
Market size in 2022
US$ 9,715.58 Billion
Market Size by 2030
US$ 11,480.39 Billion
Global CAGR (2022 - 2030)
2.1%
Historical Data
2020-2021
Forecast period
2023-2030
Segments Covered
By Betrieb
Ãbertragung und Verteilung
By Ausrüstung
Pipeline
Kompressorstation
Messanlagen
Regions and Countries Covered
Europa
Großbritannien
Deutschland
Frankreich
Russland
Italien
Rest von Europa
Market leaders and key company profiles
Enbridge Inc
Berkshire Hathaway Inc
Kinder Morgan Inc
Beltps
Enagas SA
Saipem SpA
Get more information on this report
Europe Gas Pipeline Infrastructure Regional Insights
The regional scope of Europe Gas Pipeline Infrastructure refers to the geographical area in which a business operates and competes. Understanding regional nuances, such as local consumer preferences, economic conditions, and regulatory environments, is crucial for tailoring strategies to specific markets. Businesses can expand their reach by identifying underserved regions or adapting their offerings to meet regional demands. A clear regional focus allows for more effective resource allocation, targeted marketing, and better positioning against local competitors, ultimately driving growth in those specific areas.
Get more information on this report
Identical Market Reports with other Region/Countries
The List of Companies - Europe Gas Pipeline Infrastructure Market
1. Enbridge Inc 2. Berkshire Hathaway Inc 3. Kinder Morgan Inc 4. Beltps 5. Enagas SA 6. Saipem SpA
Frequently Asked Questions
How big is the Europe Gas Pipeline Infrastructure Market?
The Europe Gas Pipeline Infrastructure Market is valued at US$ 9,715.58 Billion in 2022, it is projected to reach US$ 11,480.39 Billion by 2030.
What is the CAGR for Europe Gas Pipeline Infrastructure Market by (2022 - 2030)?
As per our report Europe Gas Pipeline Infrastructure Market, the market size is valued at US$ 9,715.58 Billion in 2022, projecting it to reach US$ 11,480.39 Billion by 2030. This translates to a CAGR of approximately 2.1% during the forecast period.
What segments are covered in this report?
The Europe Gas Pipeline Infrastructure Market report typically cover these key segments-
What is the historic period, base year, and forecast period taken for Europe Gas Pipeline Infrastructure Market?
The historic period, base year, and forecast period can vary slightly depending on the specific market research report. However, for the Europe Gas Pipeline Infrastructure Market report:
Historic Period : 2020-2021
Base Year : 2022
Forecast Period : 2023-2030
Who are the major players in Europe Gas Pipeline Infrastructure Market?
The Europe Gas Pipeline Infrastructure Market is populated by several key players, each contributing to its growth and innovation. Some of the major players include:
Enbridge Inc
Berkshire Hathaway Inc
Kinder Morgan Inc
Beltps
Enagas SA
Saipem SpA
Who should buy this report?
The Europe Gas Pipeline Infrastructure Market report is valuable for diverse stakeholders, including:
Investors: Provides insights for investment decisions pertaining to market growth, companies, or industry insights. Helps assess market attractiveness and potential returns.
Industry Players: Offers competitive intelligence, market sizing, and trend analysis to inform strategic planning, product development, and sales strategies.
Suppliers and Manufacturers: Helps understand market demand for components, materials, and services related to concerned industry.
Researchers and Consultants: Provides data and analysis for academic research, consulting projects, and market studies.
Financial Institutions: Helps assess risks and opportunities associated with financing or investing in the concerned market.
Essentially, anyone involved in or considering involvement in the Europe Gas Pipeline Infrastructure Market value chain can benefit from the information contained in a comprehensive market report.
Get Free Sample For Europe Gas Pipeline Infrastructure Market
1. Complete the form
2. Check your inbox (and spam/junk folder)
3. Your Personal Data is Secure with us
GDPR + CCPA Compliant
Personal & transactional information is kept safe from unauthorized use.
WHAT'S INCLUDED IN FULL REPORT : Market Dynamics,
Competitive Analysis and Assessment, Define Business Strategies, Market Outlook and
Trends, Market Size and Share Analysis, Growth Driving Factors, Future Commercial
Potential, Identify Regional Growth Engines


 Get Free Sample For Europe Gas Pipeline Infrastructure Market

