Analysis - by Deployment Type (Cloud-based, and Web-based), Modality (MRI, CT-Scan, X-ray, Ultrasound, and Others), Application (Musculoskeletal System, Gastroenterology, Cardiology, Oncology, Neurology, and Others), and End User (Hospitals and Clinics, Diagnostic and Imaging Centers, and Others)
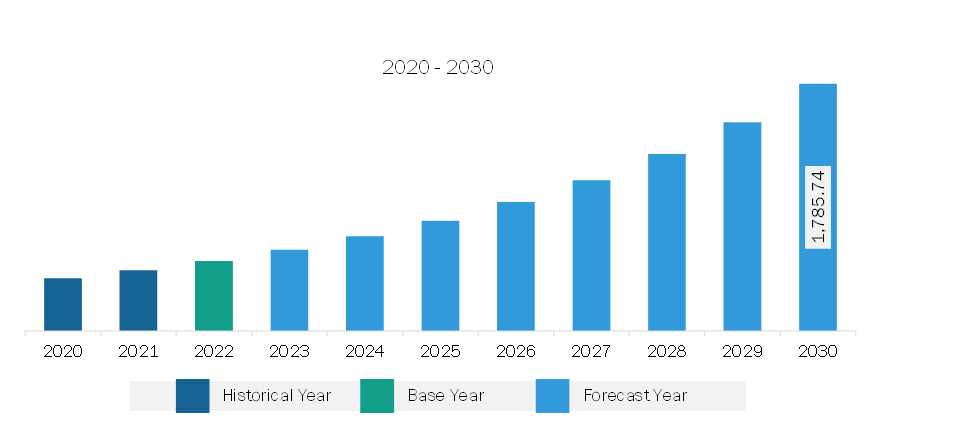
The Asia Pacific teleradiology services market was valued at US$ 505.03 million in 2022 and is expected to reach US$ 1,785.74 million by 2030; it is estimated to register a CAGR of 17.1% from 2022 to 2030.
Adoption of Artificial Intelligence (AI) in Teleradiology Boosts Asia Pacific Teleradiology Services Market
Although it is difficult in the near term to create and train the number of radiologists required to meet the demand, the adoption of smart solutions and newer technologies, such as AI and Internet of Things (IoT), can be the key to the next breakthrough in patient care. During 2011-2020, a significantly larger number of devices were connected to the Internet than ever before, and this trend will continue steadily in the coming decades as well. The emergence of the IoT has propelled the development of various health practices aimed at improving population health. These services have been extensively informative and can be used for a variety of purposes across single condition and cluster condition management, including allowing healthcare professionals to track and monitor patient progress remotely, improving self-management of chronic conditions, assisting in the early detection of abnormalities, and accelerating symptom identification and clinical diagnoses. Further, IoT-powered apps have the potential to make better use of healthcare resources while providing high-quality, low-cost medical treatment. For instance, the Mobile MIM app was the first medical app in Apple's App Store. It is used to view, register, fuse, and show medical images from SPECT, PET, CT, MRI, X-ray, and ultrasound examinations for diagnosis purposes. Mobile MIM enhances physicians' access to pictures and allows them to consult with peers by providing wireless and portable access to medical images. AI can assist in creating an inbuilt system that prioritizes cases based on protocol requirements. For example, cases of stroke and trauma can be prioritized and assigned to the Radiologist's work lists, thereby saving many lives. An integrated cloud-based RIS/PACS platform incorporating AI capabilities will help radiologists review the cases automatically and simultaneously. With faster turnaround times, reduced radiologist burnout, and fewer errors, AI-powered and IoT-powered teleradiology platforms are expected to improve radiology interpretation and provide faster reports.
Asia Pacific Teleradiology Services Market Overview
The teleradiology services market in Asia Pacific is sub segmented into India, China, Japan, Australia, South Korea, and the Rest of Asia Pacific. Rising geriatric population; increasing chronic diseases; growing research activities and technological advancements; and surging number of startups, biotechnology, and biopharmaceutical companies are the factors favoring the market progress in this region. The rising prevalence of neurological diseases and the growing adoption of teleradiology services are boosting the market growth. China has experienced a significant rise in the elderly population. Stroke is the leading cause of death among older people across the country. According to the study published by Elsevier, 17.8 million cases of stroke, 3.4 million new strokes, and 2.3 million stroke-related deaths were reported in 2020. As per the data released by the World Health Organization in April 2020, in China, there were ~4,568,754 new cancer cases and 3,002,899 deaths due to cancer. According to a study published in 2023 in the Journal of the American Medical Association, chronic kidney disease (CKD) prevalence in people aged 18 years or older in Mainland China is recorded at 8.2%. Moreover, the latest data from the International Agency for Research on Cancer (IARC) indicates that the estimated age-standardized rate (ASR) for stomach cancer in China is 21 per 100,000, and the crude rate is 33.06; for pancreatic cancer, the ASR is 5 per 100,000 with the crude rate of 8.6. As per the same source, the estimated number of new cases of stomach cancer and pancreatic cancer in people aged 0-74 in 2020 (for both sexes) was 478,508 and 124,994, respectively. Thus, the high burden of chronic diseases propels the demand for teleradiology services in China.
Asia Pacific Teleradiology Services Market Revenue and Forecast to 2030 (US$ Million)
Based on deployment type, the Asia Pacific is bifurcated into cloud-based and web-based. The cloud-based segment held a larger Asia Pacific share in 2022.
In terms of modality, the Asia Pacific is segmented into MRI, CT-scan, X-ray, ultrasound, and others. The CT-scan segment held the largest Asia Pacific share in 2022.
By application, the Asia Pacific is divided into musculoskeletal system, gastroenterology, cardiology, oncology, neurology, and others. The musculoskeletal system segment held the largest Asia Pacific share in 2022.
In terms of end user, the Asia Pacific is categorized into hospitals and clinics, diagnostic and imaging centers, others. The hospitals and clinics segment held the largest Asia Pacific share in 2022.
By country, the Asia Pacific is segmented into China, Japan, Australia, India, South Korea, and the Rest of Asia Pacific. China dominated the Asia Pacific share in 2022.
Aster Medical Imaging LLC, medavis GmbH, Teleradiology Solutions Inc, TeleDiagnosys LLC, and Agilus Diagnostics Ltd are some of the leading companies operating in the Asia Pacific .
Asia Pacific Teleradiology Services Market Strategic Insights
Get more information on this report
Asia Pacific Teleradiology Services Market Segmentation Analysis
Asia Pacific Teleradiology Services Market Report Highlights
Asia Pacific Teleradiology Services Report Scope
Report Attribute
Details
Market size in 2022
US$ 505.03 Million
Market Size by 2030
US$ 1,785.74 Million
CAGR (2022 - 2030)
17.1%
Historical Data
2020-2021
Forecast period
2023-2030
Segments Covered
By Deployment Type
Cloud-based
Web-based
By Modality
MRI
CT-Scan
X-ray
Ultrasound
By End User
Hospitals and Clinics
Diagnostic and Imaging Centers
Regions and Countries Covered
Asia-Pacific
China, India, Japan, Australia, Rest of Asia-Pacific
Market leaders and key company profiles
Aster Medical Imaging LLC
medavis GmbH
Teleradiology Solutions Inc
TeleDiagnosys LLC
Agilus Diagnostics Ltd
Get more information on this report
Asia Pacific Teleradiology Services Market Country and Regional Insights
Get more information on this report
Identical Market Reports with other Region/Countries
The List of Companies - Asia Pacific Teleradiology Services Market
1. Aster Medical Imaging LLC 2. medavis GmbH 3. Teleradiology Solutions Inc 4. TeleDiagnosys LLC 5. Agilus Diagnostics Ltd
Frequently Asked Questions
How big is the Asia Pacific Teleradiology Services Market?
The Asia Pacific Teleradiology Services Market is valued at US$ 505.03 Million in 2022, it is projected to reach US$ 1,785.74 Million by 2030.
What is the CAGR for Asia Pacific Teleradiology Services Market by (2022 - 2030)?
As per our report Asia Pacific Teleradiology Services Market, the market size is valued at US$ 505.03 Million in 2022, projecting it to reach US$ 1,785.74 Million by 2030. This translates to a CAGR of approximately 17.1% during the forecast period.
What segments are covered in this report?
The Asia Pacific Teleradiology Services Market report typically cover these key segments-
Deployment Type (Cloud-based, Web-based)
Modality (MRI, CT-Scan, X-ray, Ultrasound)
End User (Hospitals and Clinics, Diagnostic and Imaging Centers)
What is the historic period, base year, and forecast period taken for Asia Pacific Teleradiology Services Market?
The historic period, base year, and forecast period can vary slightly depending on the specific market research report. However, for the Asia Pacific Teleradiology Services Market report:
Historic Period : 2020-2021
Base Year : 2022
Forecast Period : 2023-2030
Who are the major players in Asia Pacific Teleradiology Services Market?
The Asia Pacific Teleradiology Services Market is populated by several key players, each contributing to its growth and innovation. Some of the major players include:
Aster Medical Imaging LLC
medavis GmbH
Teleradiology Solutions Inc
TeleDiagnosys LLC
Agilus Diagnostics Ltd
Who should buy this report?
The Asia Pacific Teleradiology Services Market report is valuable for diverse stakeholders, including:
Investors: Provides insights for investment decisions pertaining to market growth, companies, or industry insights. Helps assess market attractiveness and potential returns.
Industry Players: Offers competitive intelligence, market sizing, and trend analysis to inform strategic planning, product development, and sales strategies.
Suppliers and Manufacturers: Helps understand market demand for components, materials, and services related to concerned industry.
Researchers and Consultants: Provides data and analysis for academic research, consulting projects, and market studies.
Financial Institutions: Helps assess risks and opportunities associated with financing or investing in the concerned market.
Essentially, anyone involved in or considering involvement in the Asia Pacific Teleradiology Services Market value chain can benefit from the information contained in a comprehensive market report.


 Get Free Sample For Asia Pacific Teleradiology Services Market


