Marktprognose für Bergbauchemikalien im asiatisch-pazifischen Raum bis 2030 – Regionale Analyse – nach Typ [Flotationschemikalien (Schäumer, Flockungsmittel, Depressiva, Sammler und andere), Lösungsmittelextraktionsmittel, Mahlhilfen und andere], Mineraltyp (Basismetalle, nichtmetallische Mineralien, Edelmetalle und andere) und Anwendung (Mineralverarbeitung, Abwasserbehandlung und andere)

BMIRE00030199 | Pages: 132 | Chemicals and Materials | Jun 2024 | Type: Regional | Status: Published
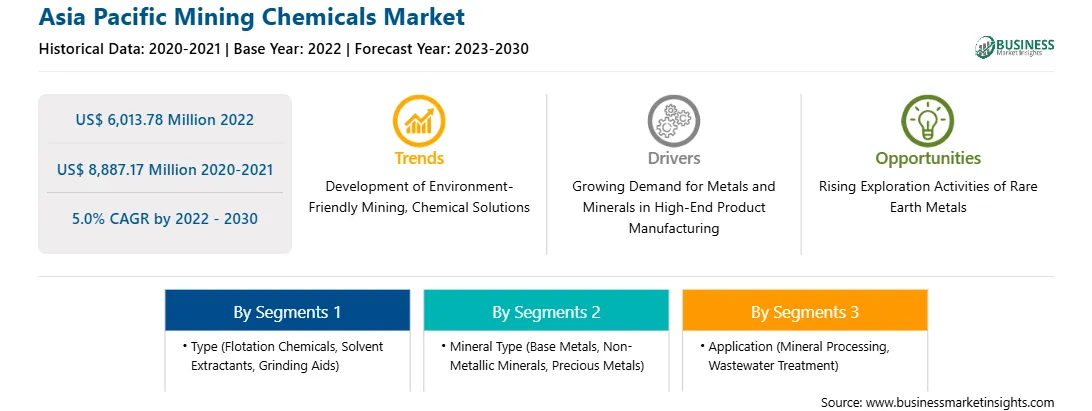
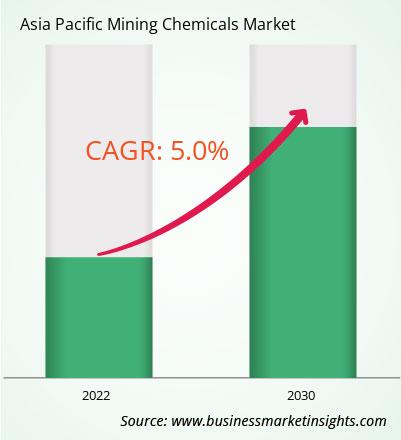
Der Markt für Bergbauchemikalien im asiatisch-pazifischen Raum wurde im Jahr 2022 auf 6.013,78 Millionen US-Dollar geschätzt und soll bis 2030 8.887,17 Millionen US-Dollar erreichen; von 2022 bis 2030 wird eine durchschnittliche jährliche Wachstumsrate von 5,0 % geschätzt.

Zunehmende Investitionen und Aktivitäten im globalen Bergbausektor kurbeln den Markt für Bergbauchemikalien im asiatisch-pazifischen Raum an

Die Zunahme der Bergbauaktivitäten weltweit hat zu einer steigenden Nachfrage nach Bergbauchemikalien geführt. Darüber hinaus verbessert die Einführung fortschrittlicher Bergbautechnologien wie Automatisierung und Digitalisierung die Effizienz und ökologische Nachhaltigkeit von Bergbaubetrieben weltweit. Laut der Weltbank soll die Produktion von Graphit, Lithium und Kobalt bis 2050 um etwa 500 % steigen, um die wachsende Nachfrage nach sauberen Energietechnologien zu decken.

Die Region erlebt eine Zunahme der Bergbauaktivitäten aufgrund der Entdeckung neuer Mineralvorkommen, wachsender Infrastrukturentwicklungen und steigender Nachfrage nach Mineralien und Ressourcen. Regierungen und Organisationen in Ländern wie Australien, China, der Tschechischen Republik, Portugal, den USA, Kanada und anderen fördern aktiv Explorations- und Bergbauaktivitäten. Laut einem Bericht des Green Finance and Development Centre erreichten die Investitionen in die Metall- und Bergbauindustrie in China im ersten Halbjahr 2023 10 Milliarden US-Dollar, ein Anstieg von 131 % im Vergleich zum gleichen Zeitraum im Jahr 2022. Darüber hinaus investierte die australische Regierung im Oktober 2023 weitere 3,9 Milliarden US-Dollar in die von Export Finance Australia verwaltete Critical Minerals Facility. Die Finanzierung zielte auf die Unterstützung von Bergbauprojekten ab, die mit Australiens Critical Minerals Strategy 2023–2030 übereinstimmen. Die Expansionsaktivitäten und steigenden Investitionen im Bergbausektor treiben die Nachfrage nach Bergbauchemikalien an.

Marktübersicht für Bergbauchemikalien im asiatisch-pazifischen Raum

Im asiatisch-pazifischen Raum sind große Bergbauunternehmen wie Mitsubishi Materials Corporation, Jiangxi Copper Co Ltd, Aluminum Corporation of China Ltd, Coal India Limited, China Molybdenum Co Ltd, BHP und andere vertreten. Im asiatisch-pazifischen Raum gibt es 10 große Tagebauprojekte: Green Mine (China), Sangatta Mine (Indonesien), Heidaigou Mine (China), Oyu Tolgoi Copper-Gold Mine (Mongolei), Gevra OC Mine (Indien), Letpadaung Copper Mine (Myanmar), Li Mine (Thailand), FTB Project (Thailand) und Pasir Mine (Indonesien). Laut dem 2022 vom US Geological Survey veröffentlichten Bericht war China 2021 der größte Lieferant von 25 nichtbrennbaren Mineralrohstoffen für mehrere Länder weltweit. Darüber hinaus ist China der Produzent von 16 kritischen Mineralien von 25 aufgeführten Mineralien. Laut einer Studie des Norwegischen Instituts für Internationale Angelegenheiten aus dem Jahr 2022 verfügt Zentralasien über 38,6 % der weltweiten Manganerzreserven, 30,07 % Chrom, 20 % Blei, 12,6 % Zink, 8,7 % Titan, 5,8 % Aluminium und 5,3 % Kupfer.

China, Tadschikistan, Australien, Vietnam und andere Länder sind für die weltweit größte Antimonminenproduktion und -reserven verantwortlich. Laut dem vom Bundesministerium der Republik Österreich veröffentlichten Bericht „World Mining Data 2022“ stieg die Bergbauproduktionsrate für Mineralien in Australien zwischen 2000 und 2020 um 142,2 %. Laut der Internationalen Energieagentur haben chinesische Unternehmen ihre Investitionen in die Exploration kritischer Mineralien, insbesondere in Lithiumprojekte, verdoppelt. Die Nachfrage nach Bergbauchemikalien ist direkt proportional zu den Bergbaubetrieben und Mineralexplorationsaktivitäten in der Region. Daher stärkt das Wachstum des Bergbaus die Nachfrage nach Bergbauchemikalien im asiatisch-pazifischen Raum.

Marktumsatz und Prognose für Bergbauchemikalien im asiatisch-pazifischen Raum bis 2030 (Mio. USD)

Marktsegmentierung für Bergbauchemikalien im asiatisch-pazifischen Raum

Der Markt für Bergbauchemikalien im asiatisch-pazifischen Raum ist nach Typ, Mineralart, Anwendung und Land segmentiert.

Nach Typ ist der Markt für Bergbauchemikalien im asiatisch-pazifischen Raum in Flotationschemikalien, Lösungsmittelextraktionsmittel, Mahlhilfsmittel und andere unterteilt. Das Segment Flotationschemikalien ist weiter unterteilt in Schäumer, Flockungsmittel, Depressiva, Sammler und andere. Das Segment Flotationschemikalien hatte 2022 den größten Anteil.

Nach Mineralart ist der Markt für Bergbauchemikalien im asiatisch-pazifischen Raum in unedle Metalle, nichtmetallische Mineralien, Edelmetalle und andere segmentiert. Das Segment nichtmetallische Mineralien hatte 2022 den größten Anteil.

Nach Anwendung ist der Markt für Bergbauchemikalien im asiatisch-pazifischen Raum in Mineralverarbeitung, Abwasserbehandlung und andere segmentiert. Das Segment Mineralverarbeitung hatte 2022 den größten Anteil.

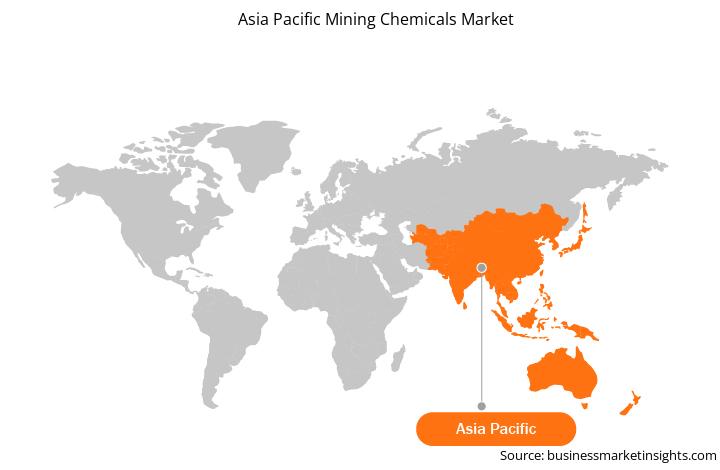
Nach Ländern wird der Markt für Bergbauchemikalien im asiatisch-pazifischen Raum in Australien, China, Indien, Japan, Südkorea und den Rest des asiatisch-pazifischen Raums unterteilt. China dominierte 2022 den Markt für Bergbauchemikalien im asiatisch-pazifischen Raum.

Orica Ltd, Kemira Oyj, BASF SE, Clariant AG, Dow Inc, AECI Ltd, Nouryon Chemicals Holding BV, Solvay SA und Arkema SA sind einige der führenden Unternehmen auf dem Markt für Bergbauchemikalien im asiatisch-pazifischen Raum.

Table of Content


1. Introduction

1.1 The Insight Partners Research Report Guidance

1.2 Market Segmentation

2. Executive Summary

2.1 Key Insights

2.2 Market Attractiveness

2.2.1 Market Attractiveness

3. Research Methodology

3.1 Coverage

3.2 Secondary Research

3.3 Primary Research

4. Asia Pacific Mining Chemicals Market Landscape

4.1 Overview

4.2 Porter's Five Forces Analysis

4.2.1 Bargaining Power of Suppliers

4.2.2 Bargaining Power of Buyers

4.2.3 Threat of New Entrants

4.2.4 Competitive Rivalry

4.2.5 Threat of Substitutes

4.3 Ecosystem Analysis

4.3.1 Raw Material Suppliers:

4.3.2 Manufacturers:

4.3.3 Distributors or Suppliers:

4.3.4 End Use Industry:

4.4 List of Vendors in the Value Chain

5. Asia Pacific Mining Chemicals Market - Key Market Dynamics

5.1 Market Drivers

5.1.1 Growing Demand for Metals and Minerals in High-End Product Manufacturing

5.1.2 Increasing Investments and Operations in Global Mining Sector

5.2 Market Restraints

5.2.1 Stringent Government Regulations Related to Hazardous Mining Chemicals

5.3 Market Opportunities

5.3.1 Rising Exploration Activities of Rare Earth Metals

5.4 Future Trends

5.4.1 Development of Environment-Friendly Mining Chemical Solutions

5.5 Impact Analysis

6. Mining Chemicals Market - Asia Pacific Market Analysis

6.1 Asia Pacific Mining Chemicals Market Revenue (US$ Million), 2022 - 2030

6.2 Asia Pacific Mining Chemicals Market Forecast and Analysis

7. Asia Pacific Mining Chemicals Market Analysis - Type

7.1 Flotation Chemicals

7.1.1 Overview

7.1.2 Flotation Chemicals Market Revenue and Forecast to 2030 (US$ Million)

7.1.2.1 Flotation Chemicals Market Volume and Forecast to 2030 (Kilo tons)

7.1.3 Frothers

7.1.3.1 Overview

7.1.3.2 Frothers Market Revenue and Forecast to 2030 (US$ Million)

7.1.3.3 Frothers Market Volume and Forecast to 2030 (Kilo tons)

7.1.4 Flocculants

7.1.4.1 Overview

7.1.4.2 Flocculants Market Revenue and Forecast to 2030 (US$ Million)

7.1.4.3 Flocculants Market Volume and Forecast to 2030 (Kilo tons)

7.1.5 Depressants

7.1.5.1 Overview

7.1.5.2 Depressants Market Revenue and Forecast to 2030 (US$ Million)

7.1.5.3 Depressants Market Volume and Forecast to 2030 (Kilo tons)

7.1.6 Collectors

7.1.6.1 Overview

7.1.6.2 Collectors Market Revenue and Forecast to 2030 (US$ Million)

7.1.6.3 Collectors Market Volume and Forecast to 2030 (Kilo tons)

7.1.7 Others

7.1.7.1 Overview

7.1.7.2 Others Market Revenue and Forecast to 2030 (US$ Million)

7.1.7.3 Others Market Volume and Forecast to 2030 (Kilo tons)

7.2 Solvent Extractants

7.2.1 Overview

7.2.1.1 Solvent Extractants Market Revenue and Forecast to 2030 (US$ Million)

7.2.1.2 Solvent Extractants Market Volume and Forecast to 2030 (Kilo tons)

7.3 Grinding Aids

7.3.1 Overview

7.3.1.1 Grinding Aids Market Revenue and Forecast to 2030 (US$ Million)

7.3.1.2 Grinding Aids Market Volume and Forecast to 2030 (Kilo tons)

7.4 Others

7.4.1 Overview

7.4.1.1 Others Market Revenue and Forecast to 2030 (US$ Million)

7.4.1.2 Others Market Volume and Forecast to 2030 (Kilo tons)

8. Asia Pacific Mining Chemicals Market Analysis - Mineral Type

8.1 Base Metals

8.1.1 Overview

8.1.1.1 Base Metals Market Revenue and Forecast to 2030 (US$ Million)

8.2 Non-Metallic Minerals

8.2.1 Overview

8.2.1.1 Non-metallic minerals Market Revenue and Forecast to 2030 (US$ Million)

8.3 Precious Metals

8.3.1 Overview

8.3.1.1 Precious Metals Market Revenue and Forecast to 2030 (US$ Million)

8.4 Others

8.4.1 Overview

8.4.1.1 Others Market Revenue and Forecast to 2030 (US$ Million)

9. Asia Pacific Mining Chemicals Market Analysis - Application

9.1 Mineral Processing

9.1.1 Overview

9.1.1.1 Mineral Processing Market Revenue and Forecast to 2030 (US$ Million)

9.2 Wastewater Treatment

9.2.1 Overview

9.2.1.1 Wastewater Treatment Market Revenue and Forecast to 2030 (US$ Million)

9.3 Others

9.3.1 Overview

9.3.1.1 Others Market Revenue and Forecast to 2030 (US$ Million)

10. Asia Pacific Mining Chemicals Market - Country Analysis

10.1.1 Asia Pacific Mining Chemicals Market Revenue and Forecasts and Analysis - By Countries

10.1.1.1 Mining Chemicals market Breakdown by Country

10.1.1.2 Australia Mining Chemicals Market Volume and Forecasts to 2030 (Kilo tons)

10.1.1.3 Australia Mining Chemicals Market Revenue and Forecasts to 2030 (US$ Million)

10.1.1.3.1 Australia Mining Chemicals Market Breakdown by Type

10.1.1.3.2 Australia Mining Chemicals Market Breakdown by Type

10.1.1.3.3 Australia Mining Chemicals Market Breakdown by Mineral Type

10.1.1.3.4 Australia Mining Chemicals Market Breakdown by Application

10.1.1.4 China Mining Chemicals Market Volume and Forecasts to 2030 (Kilo tons)

10.1.1.5 China Mining Chemicals Market Revenue and Forecasts to 2030 (US$ Million)

10.1.1.5.1 China Mining Chemicals Market Breakdown by Type

10.1.1.5.2 China Mining Chemicals Market Breakdown by Type

10.1.1.5.3 China Mining Chemicals Market Breakdown by Mineral Type

10.1.1.5.4 China Mining Chemicals Market Breakdown by Application

10.1.1.6 India Mining Chemicals Market Volume and Forecasts to 2030 (Kilo tons)

10.1.1.7 India Mining Chemicals Market Revenue and Forecasts to 2030 (US$ Million)

10.1.1.7.1 India Mining Chemicals Market Breakdown by Type

10.1.1.7.2 India Mining Chemicals Market Breakdown by Type

10.1.1.7.3 India Mining Chemicals Market Breakdown by Mineral Type

10.1.1.7.4 India Mining Chemicals Market Breakdown by Application

10.1.1.8 Japan Mining Chemicals Market Volume and Forecasts to 2030 (Kilo tons)

10.1.1.9 Japan Mining Chemicals Market Revenue and Forecasts to 2030 (US$ Million)

10.1.1.9.1 Japan Mining Chemicals Market Breakdown by Type

10.1.1.9.2 Japan Mining Chemicals Market Breakdown by Type

10.1.1.9.3 Japan Mining Chemicals Market Breakdown by Mineral Type

10.1.1.9.4 Japan Mining Chemicals Market Breakdown by Application

10.1.1.10 South Korea Mining Chemicals Market Volume and Forecasts to 2030 (Kilo tons)

10.1.1.11 South Korea Mining Chemicals Market Revenue and Forecasts to 2030 (US$ Million)

10.1.1.11.1 South Korea Mining Chemicals Market Breakdown by Type

10.1.1.11.2 South Korea Mining Chemicals Market Breakdown by Type

10.1.1.11.3 South Korea Mining Chemicals Market Breakdown by Mineral Type

10.1.1.11.4 South Korea Mining Chemicals Market Breakdown by Application

10.1.1.12 Rest of Asia Pacific Mining Chemicals Market Volume and Forecasts to 2030 (Kilo tons)

10.1.1.13 Rest of Asia Pacific Mining Chemicals Market Revenue and Forecasts to 2030 (US$ Million)

10.1.1.13.1 Rest of Asia Pacific Mining Chemicals Market Breakdown by Type

10.1.1.13.2 Rest of Asia Pacific Mining Chemicals Market Breakdown by Type

10.1.1.13.3 Rest of Asia Pacific Mining Chemicals Market Breakdown by Mineral Type

10.1.1.13.4 Rest of Asia Pacific Mining Chemicals Market Breakdown by Application

11. Industry Landscape

11.1 Overview

11.2 Product launch

11.3 Other Strategies and Developments

12. Company Profiles

12.1 Orica Ltd

12.1.1 Key Facts

12.1.2 Business Description

12.1.3 Products and Services

12.1.4 Financial Overview

12.1.5 SWOT Analysis

12.1.6 Key Developments

12.2 Kemira Oyj

12.2.1 Key Facts

12.2.2 Business Description

12.2.3 Products and Services

12.2.4 Financial Overview

12.2.5 SWOT Analysis

12.2.6 Key Developments

12.3 BASF SE

12.3.1 Key Facts

12.3.2 Business Description

12.3.3 Products and Services

12.3.4 Financial Overview

12.3.5 SWOT Analysis

12.3.6 Key Developments

12.4 Clariant AG

12.4.1 Key Facts

12.4.2 Business Description

12.4.3 Products and Services

12.4.4 Financial Overview

12.4.5 SWOT Analysis

12.4.6 Key Developments

12.5 Dow Inc

12.5.1 Key Facts

12.5.2 Business Description

12.5.3 Products and Services

12.5.4 Financial Overview

12.5.5 SWOT Analysis

12.5.6 Key Developments

12.6 AECI Ltd

12.6.1 Key Facts

12.6.2 Business Description

12.6.3 Products and Services

12.6.4 Financial Overview

12.6.5 SWOT Analysis

12.6.6 Key Developments

12.7 Nouryon Chemicals Holding BV

12.7.1 Key Facts

12.7.2 Business Description

12.7.3 Products and Services

12.7.4 Financial Overview

12.7.5 SWOT Analysis

12.7.6 Key Developments

12.8 Solvay SA

12.8.1 Key Facts

12.8.2 Business Description

12.8.3 Products and Services

12.8.4 Financial Overview

12.8.5 SWOT Analysis

12.8.6 Key Developments

12.9 Arkema SA

12.9.1 Key Facts

12.9.2 Business Description

12.9.3 Products and Services

12.9.4 Financial Overview

12.9.5 SWOT Analysis

12.9.6 Key Developments

13. Appendix

?

List of Tables

Table 1. Asia Pacific Mining Chemicals Market Segmentation

Table 2. List of Raw Material Suppliers

Table 3. Asia Pacific Mining Chemicals Market Revenue and Forecasts to 2030 (US$ Million)

Table 4. Asia Pacific Mining Chemicals Market Volume and Forecasts to 2030 (Kilo tons) - Type

Table 5. Asia Pacific Mining Chemicals Market Revenue and Forecasts to 2030 (US$ Million) - Type

Table 6. Asia Pacific Mining Chemicals Market Revenue and Forecasts to 2030 (US$ Million) - Mineral Type

Table 7. Asia Pacific Mining Chemicals Market Revenue and Forecasts to 2030 (US$ Million) - Application

Table 8. Australia Mining Chemicals Market Volume and Forecasts to 2030 (Kilo tons) - By Type

Table 9. Australia Mining Chemicals Market Revenue and Forecasts to 2030 (US$ Million) - By Type

Table 10. Australia Mining Chemicals Market Revenue and Forecasts to 2030 (US$ Million) - By Mineral Type

Table 11. Australia Mining Chemicals Market Revenue and Forecasts to 2030 (US$ Million) - By Application

Table 12. China Mining Chemicals Market Volume and Forecasts to 2030 (Kilo tons) - By Type

Table 13. China Mining Chemicals Market Revenue and Forecasts to 2030 (US$ Million) - By Type

Table 14. China Mining Chemicals Market Revenue and Forecasts to 2030 (US$ Million) - By Mineral Type

Table 15. China Mining Chemicals Market Revenue and Forecasts to 2030 (US$ Million) - By Application

Table 16. India Mining Chemicals Market Volume and Forecasts to 2030 (Kilo tons) - By Type

Table 17. India Mining Chemicals Market Revenue and Forecasts to 2030 (US$ Million) - By Type

Table 18. India Mining Chemicals Market Revenue and Forecasts to 2030 (US$ Million) - By Mineral Type

Table 19. India Mining Chemicals Market Revenue and Forecasts to 2030 (US$ Million) - By Application

Table 20. Japan Mining Chemicals Market Volume and Forecasts to 2030 (Kilo tons) - By Type

Table 21. Japan Mining Chemicals Market Revenue and Forecasts to 2030 (US$ Million) - By Type

Table 22. Japan Mining Chemicals Market Revenue and Forecasts to 2030 (US$ Million) - By Mineral Type

Table 23. Japan Mining Chemicals Market Revenue and Forecasts to 2030 (US$ Million) - By Application

Table 24. South Korea Mining Chemicals Market Revenue and Forecasts to 2030 (US$ Million) - By Type

Table 25. South Korea Mining Chemicals Market Revenue and Forecasts to 2030 (US$ Million) - By Type

Table 26. South Korea Mining Chemicals Market Revenue and Forecasts to 2030 (US$ Million) - By Mineral Type

Table 27. South Korea Mining Chemicals Market Revenue and Forecasts to 2030 (US$ Million) - By Application

Table 28. Rest of Asia Pacific Mining Chemicals Market Volume and Forecasts to 2030 (Kilo tons) - By Type

Table 29. Rest of Asia Pacific Mining Chemicals Market Revenue and Forecasts to 2030 (US$ Million) - By Type

Table 30. Rest of Asia Pacific Mining Chemicals Market Revenue and Forecasts to 2030 (US$ Million) - By Mineral Type

Table 31. Rest of Asia Pacific Mining Chemicals Market Revenue and Forecasts to 2030 (US$ Million) - By Application

?

List of Figures

Figure 1. Asia Pacific Mining Chemicals Market Segmentation, By Country

Figure 2. Porter's Five Forces Analysis

Figure 3. Ecosystem: Asia Pacific Mining Chemicals Market

Figure 4. Asia Pacific Mining Chemicals Market Impact Analysis of Drivers and Restraints

Figure 5. Asia Pacific Mining Chemicals Market Revenue (US$ Million), 2022 - 2030

Figure 6. Asia Pacific Mining Chemicals Market Share (%) - Type, 2022 and 2030

Figure 7. Flotation Chemicals Market Revenue and Forecasts to 2030 (US$ Million)

Figure 8. Flotation Chemicals Market Volume and Forecasts to 2030 (Kilo tons)

Figure 9. Frothers Market Revenue and Forecasts to 2030 (US$ Million)

Figure 10. Frothers Market Volume and Forecasts to 2030 (Kilo tons)

Figure 11. Flocculants Market Revenue and Forecasts to 2030 (US$ Million)

Figure 12. Flocculants Market Volume and Forecasts to 2030 (Kilo tons)

Figure 13. Depressants Market Revenue and Forecasts to 2030 (US$ Million)

Figure 14. Depressants Market Volume and Forecasts to 2030 (Kilo tons)

Figure 15. Collectors Market Revenue and Forecasts to 2030 (US$ Million)

Figure 16. Collectors Market Volume and Forecasts to 2030 (Kilo tons)

Figure 17. Others Market Revenue and Forecasts to 2030 (US$ Million)

Figure 18. Others Market Volume and Forecasts to 2030 (Kilo tons)

Figure 19. Solvent Extractants Market Revenue and Forecasts to 2030 (US$ Million)

Figure 20. Solvent Extractants Market Volume and Forecasts to 2030 (Kilo tons)

Figure 21. Grinding Aids Market Revenue and Forecasts to 2030 (US$ Million)

Figure 22. Grinding Aids Market Volume and Forecasts to 2030 (Kilo tons)

Figure 23. Others Market Revenue and Forecasts to 2030 (US$ Million)

Figure 24. Others Market Volume and Forecasts to 2030 (Kilo tons)

Figure 25. Asia Pacific Mining Chemicals Market Share (%) - Mineral Type, 2022 and 2030

Figure 26. Base Metals Market Revenue and Forecasts to 2030 (US$ Million)

Figure 27. Non-Metallic Minerals Market Revenue and Forecasts to 2030 (US$ Million)

Figure 28. Precious Metals Market Revenue and Forecasts to 2030 (US$ Million)

Figure 29. Others Market Revenue and Forecasts to 2030 (US$ Million)

Figure 30. Asia Pacific Mining Chemicals Market Share (%) - Application, 2022 and 2030

Figure 31. Mineral Processing Market Revenue and Forecasts to 2030 (US$ Million)

Figure 32. Wastewater Treatment Market Revenue and Forecasts to 2030 (US$ Million)

Figure 33. Others Market Revenue and Forecasts to 2030 (US$ Million)

Figure 34. Asia Pacific Mining Chemicals Market Breakdown, by Key Countries, 2022 (US$)

Figure 35. Mining Chemicals market Breakdown by Key Countries, 2022 and 2030 (%)

Figure 36. Australia Mining Chemicals Market Volume and Forecasts to 2030 (Kilo tons)

Figure 37. Australia Mining Chemicals Market Revenue and Forecasts to 2030 (US$ Million)

Figure 38. China Mining Chemicals Market Volume and Forecasts to 2030 (Kilo tons)

Figure 39. China Mining Chemicals Market Revenue and Forecasts to 2030 (US$ Million)

Figure 40. India Mining Chemicals Market Volume and Forecasts to 2030 (Kilo tons)

Figure 41. India Mining Chemicals Market Revenue and Forecasts to 2030 (US$ Million)

Figure 42. Japan Mining Chemicals Market Volume and Forecasts to 2030 (Kilo tons)

Figure 43. Japan Mining Chemicals Market Revenue and Forecasts to 2030 (US$ Million)

Figure 44. South Korea Mining Chemicals Market Volume and Forecasts to 2030 (Kilo tons)

Figure 45. South Korea Mining Chemicals Market Revenue and Forecasts to 2030 (US$ Million)

Figure 46. Rest of Asia Pacific Mining Chemicals Market Volume and Forecasts to 2030 (Kilo tons)

Figure 47. Rest of Asia Pacific Mining Chemicals Market Revenue and Forecasts to 2030 (US$ Million)


1. Orica Ltd

2. Kemira Oyj

3. BASF SE

4. Clariant AG

5. Dow Inc

6. AECI Ltd

7. Nouryon Chemicals Holding BV

8. Solvay SA

9. Arkema SA

  • Save and reduce time carrying out entry-level research by identifying the growth, size, leading players, and segments in the Asia Pacific mining chemicals market.
  • Highlights key business priorities in order to assist companies to realign their business strategies.
  • The key findings and recommendations highlight crucial progressive industry trends in Asia Pacific mining chemicals market, thereby allowing players across the value chain to develop effective long-term strategies.
  • Develop/modify business expansion plans by using substantial growth offering developed and emerging markets.
  • Scrutinize in-depth Asia Pacific market trends and outlook coupled with the factors driving the market, as well as those hindering it.
  • Enhance the decision-making process by understanding the strategies that underpin security interest with respect to client products, segmentation, pricing, and distribution.
Report Code
Full Name
Country Name
Email Id
Phone Number
Job Title
Company
Requirement

Note : Your data will never be shared with third parties, however, we may send you information from time to time about our products that may be of interest to you. By submitting your details, you agree to be contacted by us. You may contact us at any time to opt-out.


Purchase Options
Single User License
$3550
$2840
Site License
$4550
$3640
Enterprise License
$5550
$4440