Marktprognose für Futtervormischungen im asiatisch-pazifischen Raum bis 2030 – Regionale Analyse – nach Typ (Vitamine, Mineralien, Aminosäuren, Antibiotika, Antioxidantien, Mischungen und andere), Form (trocken und flüssig) und Viehbestand (Geflügel, Wiederkäuer, Schweine, Aquakultur und andere)

BMIRE00030168 | Pages: 114 | Food and Beverages | May 2024 | Type: Regional | Status: Published
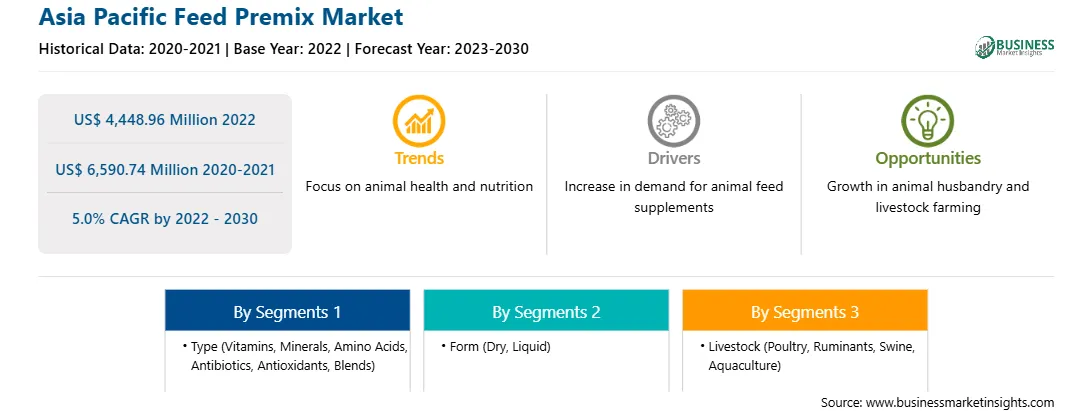
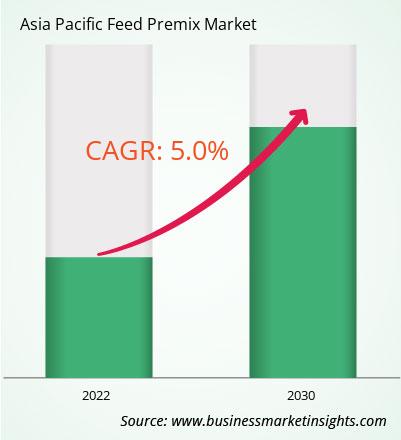
Der Markt für Futtervormischungen im asiatisch-pazifischen Raum wurde im Jahr 2022 auf 4.448,96 Millionen US-Dollar geschätzt und soll bis 2030 6.590,74 Millionen US-Dollar erreichen; es wird geschätzt, dass er von 2022 bis 2030 mit einer durchschnittlichen jährlichen Wachstumsrate von 5,0 % wächst.

Steigende Nachfrage nach Futtervormischungen aus Entwicklungsländern beflügelt den Markt für Futtervormischungen im asiatisch-pazifischen Raum

Laut dem Alltech-Bericht 2022 stieg die Produktion von Legefutter auf den Philippinen um 28 %. Der steigende Fleischkonsum und die wachsende Viehwirtschaft in Entwicklungsländern kurbeln also die Nachfrage nach Futtervormischungen an. Die Hauptursachen für die steigende Nachfrage nach Futtervormischungen in Entwicklungsländern sind Bevölkerungswachstum, Urbanisierung und steigende Löhne in Entwicklungsländern. Laut der Feed Industry Federation (FIF) hat die Produktion von Mischfutter 1000 Millionen Tonnen pro Jahr erreicht. Dieses Produktionswachstum ist in Entwicklungsländern insbesondere höher als in Industrieländern. Die Modernisierung von Viehzuchtbetrieben in Entwicklungsregionen, um die wachsende Nachfrage nach tierischem Eiweiß zu decken, unterstützt den Markt für Futtervormischungen im asiatisch-pazifischen Raum. Daher wird erwartet, dass die steigende Nachfrage nach Futtervormischungen aus Entwicklungsländern enorme Chancen für das Marktwachstum bietet.

Übersicht über den Markt für Futtervormischungen im asiatisch-pazifischen Raum

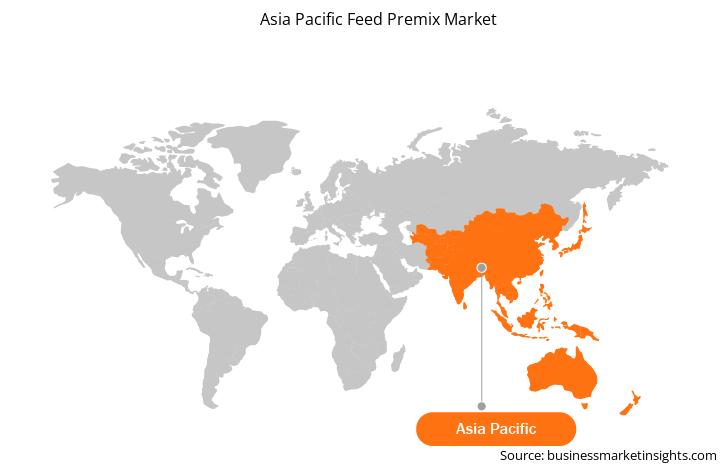
Der Markt für Futtervormischungen im asiatisch-pazifischen Raum wird im Prognosezeitraum voraussichtlich aufgrund der steigenden Tierfutterproduktion und der wachsenden Viehwirtschaft wachsen. Der asiatisch-pazifische Raum ist der weltweit größte Produzent von Tierfutter. Laut Alltech Global produzierte die Region im Jahr 2020 über 305 Millionen Tonnen Tierfutter. Darüber hinaus beherbergt die Region einige große Länder mit Tierzucht, was die Nachfrage nach Tierfutterzutaten wie Futtervormischungen in der Region beschleunigt. Die Region hat einen Anstieg der Futtermühlen und der Futterproduktion erlebt, insbesondere in Japan und Indien. Indien beherbergt den größten Viehbestand. Daher gibt es auf dem indischen Markt enorme Chancen für Futtervormischungen. Darüber hinaus hat der asiatisch-pazifische Raum von allen fünf Regionen die größte Bevölkerung und beherbergt etwa 60 % der Weltbevölkerung. Daher ist in der Region eine starke Nachfrage nach Fleisch und Milchprodukten zu verzeichnen, was den Bedarf an Viehproduktion erhöht und in der Folge die Nachfrage nach Tierfutter begünstigt. Der Massenkonsum von Tierfutter in der Region und die zunehmende Praxis, Vieh mit nährstoffreichem Futter zu füttern, treiben den Markt für Futtervormischungen im asiatisch-pazifischen Raum an. Die Hersteller tätigen erhebliche Investitionen, um der steigenden Nachfrage in der Region gerecht zu werden. So kündigte ADM, ein weltweit führendes Unternehmen im Bereich Tierernährung, im Mai 2021 die Einführung seiner Vormischungs- und Ernährungsdienste mit Wisium in China an. Das Wisium-Portfolio bietet Herstellern Zugang zu innovativen Mehrwert-Ernährungsprogrammen für alle Vieharten und einem starken internationalen Expertennetzwerk.

Umsatz und Prognose für den Markt für Futtervormischungen im asiatisch-pazifischen Raum bis 2030 (in Mio. USD)

Segmentierung des Marktes für Futtervormischungen im asiatisch-pazifischen Raum

Der Markt für Futtervormischungen im asiatisch-pazifischen Raum ist nach Art, Form, Vieh und Land segmentiert.

Nach Typ ist der Markt für Futtervormischungen im asiatisch-pazifischen Raum in Vitamine, Mineralien, Aminosäuren, Antibiotika, Antioxidantien, Mischungen und andere unterteilt. Das Segment Mischungen hatte 2022 den größten Anteil.

Nach Form ist der Markt für Futtervormischungen im asiatisch-pazifischen Raum in trocken und flüssig unterteilt. Das Trockensegment hatte 2022 einen größeren Anteil.

Nach Viehbestand ist der Markt für Futtervormischungen im asiatisch-pazifischen Raum in Forschungsgeflügel, Wiederkäuer, Schweine, Aquakultur und andere unterteilt. Das Geflügelsegment hatte 2022 den größten Anteil.

Nach Ländern ist der Markt für Futtervormischungen im asiatisch-pazifischen Raum in China, Japan, Indien, Australien, Südkorea, Philippinen, Taiwan, Pakistan, Bangladesch, Kasachstan und den Rest des asiatisch-pazifischen Raums unterteilt. China dominierte 2022 den Markt für Futtervormischungen im asiatisch-pazifischen Raum.

Agrifirm Group BV, Archer-Daniels-Midland Co, Cargill Inc, De Heus Voeders BV, Kemin Industries Inc, Koninklijke DSM NV und Nutreco NV sind einige der führenden Unternehmen auf dem Markt für Futtervormischungen im asiatisch-pazifischen Raum.

Table of Content


1. Introduction

1.1 The Insight Partners Research Report Guidance

1.2 Market Segmentation

2. Executive Summary

2.1 Key Market Insights

2.2 Market Attractiveness

3. Research Methodology

3.1 Coverage

3.2 Secondary Research

3.3 Primary Research

4. Asia Pacific Feed Premix Market Landscape

4.1 Overview

4.2 Porter's Five Forces Analysis

4.2.1 Bargaining Power of Suppliers

4.2.2 Bargaining Power of Buyers

4.2.3 Threat of New Entrants

4.2.4 Competitive Rivalry

4.2.5 Threat of Substitutes

4.3 Ecosystem Analysis

4.3.1 Raw Material Suppliers

4.3.2 Manufacturing Process

4.3.2.1 Raw Material

4.3.2.2 Formulation

4.3.2.3 Weighing

4.3.2.4 Mixing

4.3.2.5 Packaging

4.3.3 Distributors or Suppliers

4.3.4 End User

4.4 List of Vendors

5. Asia Pacific Feed Premix Market - Key Market Dynamics

5.1 Market Drivers

5.1.1 Increase in Livestock Production

5.1.2 Feed Fortification

5.2 Market Restraints

5.2.1 Bans on Antibiotics as Feed Additives

5.3 Market Opportunities

5.3.1 Growing Demand for Feed Premix from Developing Countries

5.4 Future Trends

5.4.1 Rising Preference for Organic Feed

5.5 Impact Analysis of Drivers and Restraints

6. Feed Premix Market - Asia Pacific Market Analysis

6.1 Asia Pacific Feed Premix Market Revenue (US$ Million)

6.2 Asia Pacific Feed Premix Market Forecast and Analysis (2020-2030)

7. Asia Pacific Feed Premix Market Analysis - Type

7.1 Vitamins

7.1.1 Overview

7.1.2 Vitamins: Asia Pacific Feed Premix Market Revenue and Forecast to 2030 (US$ Million)

7.2 Minerals

7.2.1 Overview

7.2.2 Minerals: Asia Pacific Feed Premix Market Revenue and Forecast to 2030 (US$ Million)

7.3 Amino Acids

7.3.1 Overview

7.3.2 Amino Acids: Asia Pacific Feed Premix Market Revenue and Forecast to 2030 (US$ Million)

7.4 Antibiotics

7.4.1 Overview

7.4.2 Antibiotics: Asia Pacific Feed Premix Market Revenue and Forecast to 2030 (US$ Million)

7.5 Antioxidants

7.5.1 Overview

7.5.2 Antioxidants: Asia Pacific Feed Premix Market Revenue and Forecast to 2030 (US$ Million)

7.6 Blends

7.6.1 Overview

7.6.2 Blends: Asia Pacific Feed Premix Market Revenue and Forecast to 2030 (US$ Million)

7.7 Others

7.7.1 Overview

7.7.2 Others: Asia Pacific Feed Premix Market Revenue and Forecast to 2030 (US$ Million)

8. Asia Pacific Feed Premix Market Revenue Analysis - By Form

8.1 Overview

8.2 Dry

8.2.1 Overview

8.2.2 Dry: Asia Pacific Feed Premix Market Revenue and Forecast to 2030 (US$ Million)

8.3 Liquid

8.3.1 Overview

8.3.2 Liquid: Asia Pacific Feed Premix Market Revenue and Forecast to 2030 (US$ Million)

9. Asia Pacific Feed Premix Market Revenue Analysis - By Livestock

9.1 Overview

9.2 Poultry

9.2.1 Overview

9.2.2 Poultry: Asia Pacific Feed Premix Market Revenue and Forecast to 2030 (US$ Million)

9.3 Ruminants

9.3.1 Overview

9.3.2 Ruminants: Asia Pacific Feed Premix Market Revenue and Forecast to 2030 (US$ Million)

9.4 Swine

9.4.1 Overview

9.4.2 Swine: Asia Pacific Feed Premix Market Revenue and Forecast to 2030 (US$ Million)

9.5 Aquaculture

9.5.1 Overview

9.5.2 Aquaculture: Asia Pacific Feed Premix Market Revenue and Forecast to 2030 (US$ Million)

9.6 Others

9.6.1 Overview

9.6.2 Others: Asia Pacific Feed Premix Market Revenue and Forecast to 2030 (US$ Million)

10. Asia Pacific Feed Premix Market - Country Analysis

10.1 Asia Pacific Feed Premix Market - Country Analysis

10.1.1 Asia Pacific Feed Premix Market Breakdown by Country

10.1.1.1 Asia Pacific Feed Premix Market Breakdown by Country

10.1.1.2 Australia: Asia Pacific Feed Premix Market Revenue and Forecasts to 2030 (US$ Million)

10.1.1.2.1 Australia: Asia Pacific Feed Premix Market Breakdown by Type

10.1.1.2.2 Australia: Asia Pacific Feed Premix Market Breakdown by Form

10.1.1.2.3 Australia: Asia Pacific Feed Premix Market Breakdown by Livestock

10.1.1.3 China: Asia Pacific Feed Premix Market Revenue and Forecasts to 2030 (US$ Million)

10.1.1.3.1 China: Asia Pacific Feed Premix Market Breakdown by Type

10.1.1.3.2 China: Asia Pacific Feed Premix Market Breakdown by Form

10.1.1.3.3 China: Asia Pacific Feed Premix Market Breakdown by Livestock

10.1.1.4 India: Asia Pacific Feed Premix Market Revenue and Forecasts to 2030 (US$ Million)

10.1.1.4.1 India: Asia Pacific Feed Premix Market Breakdown by Type

10.1.1.4.2 India: Asia Pacific Feed Premix Market Breakdown by Form

10.1.1.4.3 India: Asia Pacific Feed Premix Market Breakdown by Livestock

10.1.1.5 Japan: Asia Pacific Feed Premix Market Revenue and Forecasts to 2030 (US$ Million)

10.1.1.5.1 Japan: Asia Pacific Feed Premix Market Breakdown by Type

10.1.1.5.2 Japan: Asia Pacific Feed Premix Market Breakdown by Form

10.1.1.5.3 Japan: Asia Pacific Feed Premix Market Breakdown by Livestock

10.1.1.6 South Korea: Asia Pacific Feed Premix Market Revenue and Forecasts to 2030 (US$ Million)

10.1.1.6.1 South Korea: Asia Pacific Feed Premix Market Breakdown by Type

10.1.1.6.2 South Korea: Asia Pacific Feed Premix Market Breakdown by Form

10.1.1.6.3 South Korea: Asia Pacific Feed Premix Market Breakdown by Livestock

10.1.1.7 Philippines: Asia Pacific Feed Premix Market Revenue and Forecasts to 2030 (US$ Million)

10.1.1.7.1 Philippines: Asia Pacific Feed Premix Market Breakdown by Type

10.1.1.7.2 Philippines: Asia Pacific Feed Premix Market Breakdown by Form

10.1.1.7.3 Philippines: Asia Pacific Feed Premix Market Breakdown by Livestock

10.1.1.8 Taiwan: Asia Pacific Feed Premix Market Revenue and Forecasts to 2030 (US$ Million)

10.1.1.8.1 Taiwan: Asia Pacific Feed Premix Market Breakdown by Type

10.1.1.8.2 Taiwan: Asia Pacific Feed Premix Market Breakdown by Form

10.1.1.8.3 Taiwan: Asia Pacific Feed Premix Market Breakdown by Livestock

10.1.1.9 Pakistan: Asia Pacific Feed Premix Market Revenue and Forecasts to 2030 (US$ Million)

10.1.1.9.1 Pakistan: Asia Pacific Feed Premix Market Breakdown by Type

10.1.1.9.2 Pakistan: Asia Pacific Feed Premix Market Breakdown by Form

10.1.1.9.3 Pakistan: Asia Pacific Feed Premix Market Breakdown by Livestock

10.1.1.10 Bangladesh: Asia Pacific Feed Premix Market Revenue and Forecasts to 2030 (US$ Million)

10.1.1.10.1 Bangladesh: Asia Pacific Feed Premix Market Breakdown by Type

10.1.1.10.2 Bangladesh: Asia Pacific Feed Premix Market Breakdown by Form

10.1.1.10.3 Bangladesh: Asia Pacific Feed Premix Market Breakdown by Livestock

10.1.1.11 Kazakhstan: Asia Pacific Feed Premix Market Revenue and Forecasts to 2030 (US$ Million)

10.1.1.11.1 Kazakhstan: Asia Pacific Feed Premix Market Breakdown by Type

10.1.1.11.2 Kazakhstan: Asia Pacific Feed Premix Market Breakdown by Form

10.1.1.11.3 Kazakhstan: Asia Pacific Feed Premix Market Breakdown by Livestock

10.1.1.12 Rest of Asia Pacific: Asia Pacific Feed Premix Market Revenue and Forecasts to 2030 (US$ Million)

10.1.1.12.1 Rest of Asia Pacific: Asia Pacific Feed Premix Market Breakdown by Type

10.1.1.12.2 Rest of Asia Pacific: Asia Pacific Feed Premix Market Breakdown by Form

10.1.1.12.3 Rest of Asia Pacific: Asia Pacific Feed Premix Market Breakdown by Livestock

11. Competitive Landscape

11.1 Heat Map Analysis By Key Players

11.2 Company Positioning & Concentration

12. Company Profiles

12.1 Agrifirm Group BV

12.1.1 Key Facts

12.1.2 Business Description

12.1.3 Products and Services

12.1.4 Financial Overview

12.1.5 SWOT Analysis

12.1.6 Key Developments

12.2 Nutreco NV

12.2.1 Key Facts

12.2.2 Business Description

12.2.3 Products and Services

12.2.4 Financial Overview

12.2.5 SWOT Analysis

12.2.6 Key Developments

12.3 Archer-Daniels-Midland Co

12.3.1 Key Facts

12.3.2 Business Description

12.3.3 Products and Services

12.3.4 Financial Overview

12.3.5 SWOT Analysis

12.3.6 Key Developments

12.4 Cargill Inc

12.4.1 Key Facts

12.4.2 Business Description

12.4.3 Products and Services

12.4.4 Financial Overview

12.4.5 SWOT Analysis

12.4.6 Key Developments

12.5 Koninklijke DSM NV

12.5.1 Key Facts

12.5.2 Business Description

12.5.3 Products and Services

12.5.4 Financial Overview

12.5.5 SWOT Analysis

12.5.6 Key Developments

12.6 De Heus Voeders BV

12.6.1 Key Facts

12.6.2 Business Description

12.6.3 Products and Services

12.6.4 Financial Overview

12.6.5 SWOT Analysis

12.6.6 Key Developments

12.7 Kemin Industries Inc

12.7.1 Key Facts

12.7.2 Business Description

12.7.3 Products and Services

12.7.4 Financial Overview

12.7.5 SWOT Analysis

12.7.6 Key Developments

13. Appendix


?

List of Tables

Table 1. Asia Pacific Feed Premix Market Segmentation

Table 2. List of Vendors in Value Chain

Table 3. Asia Pacific Feed Premix Market Revenue and Forecasts to 2030 (US$ Million)

Table 4. Asia Pacific Feed Premix Market Revenue and Forecasts to 2030 (US$ Million) - Type

Table 5. Asia Pacific Feed Premix Market Revenue and Forecasts to 2030 (US$ Million) - Form

Table 6. Asia Pacific Feed Premix Market Revenue and Forecasts to 2030 (US$ Million) - Livestock

Table 7. Australia: Asia Pacific Feed Premix Market Revenue and Forecasts to 2030 (US$ Million) - by Type

Table 8. Australia: Asia Pacific Feed Premix Market Revenue and Forecasts to 2030 (US$ Million) - by Form

Table 9. Australia: Asia Pacific Feed Premix Market Revenue and Forecasts to 2030 (US$ Million) -by Livestock

Table 10. China: Asia Pacific Feed Premix Market Revenue and Forecasts to 2030 (US$ Million) - by Type

Table 11. China: Asia Pacific Feed Premix Market Revenue and Forecasts to 2030 (US$ Million) - by Form

Table 12. China: Asia Pacific Feed Premix Market Revenue and Forecasts to 2030 (US$ Million) - by Livestock

Table 13. India: Asia Pacific Feed Premix Market Revenue and Forecasts to 2030 (US$ Million) - by Type

Table 14. India: Asia Pacific Feed Premix Market Revenue and Forecasts to 2030 (US$ Million) - by Form

Table 15. India: Asia Pacific Feed Premix Market Revenue and Forecasts to 2030 (US$ Million) - by Livestock

Table 16. Japan: Asia Pacific Feed Premix Market Revenue and Forecasts to 2030 (US$ Million) - by Type

Table 17. Japan: Asia Pacific Feed Premix Market Revenue and Forecasts to 2030 (US$ Million) - by Form

Table 18. Japan: Asia Pacific Feed Premix Market Revenue and Forecasts to 2030 (US$ Million) - by Livestock

Table 19. South Korea: Asia Pacific Feed Premix Market Revenue and Forecasts to 2030 (US$ Million) - by Type

Table 20. South Korea: Asia Pacific Feed Premix Market Revenue and Forecasts to 2030 (US$ Million) - by Form

Table 21. South Korea: Asia Pacific Feed Premix Market Revenue and Forecasts to 2030 (US$ Million) - by Livestock

Table 22. Philippines: Asia Pacific Feed Premix Market Revenue and Forecasts to 2030 (US$ Million) - by Type

Table 23. Philippines: Asia Pacific Feed Premix Market Revenue and Forecasts to 2030 (US$ Million) - by Form

Table 24. Philippines: Asia Pacific Feed Premix Market Revenue and Forecasts to 2030 (US$ Million) - by Livestock

Table 25. Taiwan: Asia Pacific Feed Premix Market Revenue and Forecasts to 2030 (US$ Million) - by Type

Table 26. Taiwan: Asia Pacific Feed Premix Market Revenue and Forecasts to 2030 (US$ Million) - by Form

Table 27. Taiwan: Asia Pacific Feed Premix Market Revenue and Forecasts to 2030 (US$ Million) - by Livestock

Table 28. Pakistan: Asia Pacific Feed Premix Market Revenue and Forecasts to 2030 (US$ Million) - by Type

Table 29. Pakistan: Asia Pacific Feed Premix Market Revenue and Forecasts to 2030 (US$ Million) - by Form

Table 30. Pakistan: Asia Pacific Feed Premix Market Revenue and Forecasts to 2030 (US$ Million) - by Livestock

Table 31. Bangladesh: Asia Pacific Feed Premix Market Revenue and Forecasts to 2030 (US$ Million) - by Type

Table 32. Bangladesh: Asia Pacific Feed Premix Market Revenue and Forecasts to 2030 (US$ Million) - by Form

Table 33. Bangladesh: Asia Pacific Feed Premix Market Revenue and Forecasts to 2030 (US$ Million) - by Livestock

Table 34. Kazakhstan: Asia Pacific Feed Premix Market Revenue and Forecasts to 2030 (US$ Million) - by Type

Table 35. Kazakhstan: Asia Pacific Feed Premix Market Revenue and Forecasts to 2030 (US$ Million) - by Form

Table 36. Kazakhstan: Asia Pacific Feed Premix Market Revenue and Forecasts to 2030 (US$ Million) - by Livestock

Table 37. Rest of Asia Pacific: Asia Pacific Feed Premix Market Revenue and Forecasts to 2030 (US$ Million) - by Type

Table 38. Rest of Asia Pacific: Asia Pacific Feed Premix Market Revenue and Forecasts to 2030 (US$ Million) - by Form

Table 39. Rest of Asia Pacific: Asia Pacific Feed Premix Market Revenue and Forecasts to 2030 (US$ Million) - by Livestock

?

List of Figures

Figure 1. Asia Pacific Feed Premix Market Segmentation, By Country

Figure 2. Porter's Five Forces Analysis: Asia Pacific Feed Premix Market

Figure 3. Ecosystem: Asia Pacific Feed Premix Market

Figure 4. Asia Pacific Feed Premix Market - Key Industry Dynamics

Figure 5. Global Meat Production by Livestock Type (2001-2021)

Figure 6. Asia Pacific Feed Premix Market Impact Analysis of Drivers and Restraints

Figure 7. Asia Pacific Feed Premix Market Revenue (US$ Million), 2020 - 2030

Figure 8. Asia Pacific Feed Premix Market Share (%) - Type, 2022 and 2030

Figure 9. Vitamins: Asia Pacific Feed Premix Market Revenue and Forecast to 2030 (US$ Million)

Figure 10. Minerals: Asia Pacific Feed Premix Market Revenue and Forecast to 2030 (US$ Million)

Figure 11. Amino Acids: Asia Pacific Feed Premix Market Revenue and Forecast to 2030 (US$ Million)

Figure 12. Antibiotics: Asia Pacific Feed Premix Market Revenue and Forecast to 2030 (US$ Million)

Figure 13. Antioxidants: Asia Pacific Feed Premix Market Revenue and Forecast to 2030 (US$ Million)

Figure 14. Blends: Asia Pacific Feed Premix Market Revenue and Forecast to 2030 (US$ Million)

Figure 15. Others: Asia Pacific Feed Premix Market Revenue and Forecast to 2030 (US$ Million)

Figure 16. Asia Pacific Feed Premix Market Revenue Share, By Form (2022 and 2030)

Figure 17. Dry: Asia Pacific Feed Premix Market Revenue and Forecast to 2030 (US$ Million)

Figure 18. Liquid: Asia Pacific Feed Premix Market Revenue and Forecast to 2030 (US$ Million)

Figure 19. Asia Pacific Feed Premix Market Revenue Share, By Livestock (2022 and 2030)

Figure 20. Poultry: Asia Pacific Feed Premix Market Revenue and Forecast to 2030 (US$ Million)

Figure 21. Ruminants: Asia Pacific Feed Premix Market Revenue and Forecast to 2030 (US$ Million)

Figure 22. Swine: Asia Pacific Feed Premix Market Revenue and Forecast to 2030 (US$ Million)

Figure 23. Aquaculture: Asia Pacific Feed Premix Market Revenue and Forecast to 2030 (US$ Million)

Figure 24. Others: Asia Pacific Feed Premix Market Revenue and Forecast to 2030 (US$ Million)

Figure 25. Asia Pacific Feed Premix Market Breakdown By Key Countries - Revenue (2022) (US$ Million)

Figure 26. Asia Pacific Feed Premix Market Breakdown By Key Countries, 2022 and 2030 (%)

Figure 27. Australia: Asia Pacific Feed Premix Market Revenue and Forecasts to 2030 (US$ Million)

Figure 28. China: Asia Pacific Feed Premix Market Revenue and Forecasts to 2030 (US$ Million)

Figure 29. India: Asia Pacific Feed Premix Market Revenue and Forecasts to 2030 (US$ Million)

Figure 30. Japan: Asia Pacific Feed Premix Market Revenue and Forecasts to 2030 (US$ Million)

Figure 31. South Korea: Asia Pacific Feed Premix Market Revenue and Forecasts to 2030 (US$ Million)

Figure 32. Philippines: Asia Pacific Feed Premix Market Revenue and Forecasts to 2030 (US$ Million)

Figure 33. Taiwan: Asia Pacific Feed Premix Market Revenue and Forecasts to 2030 (US$ Million)

Figure 34. Pakistan: Asia Pacific Feed Premix Market Revenue and Forecasts to 2030 (US$ Million)

Figure 35. Bangladesh: Asia Pacific Feed Premix Market Revenue and Forecasts to 2030 (US$ Million)

Figure 36. Kazakhstan: Asia Pacific Feed Premix Market Revenue and Forecasts to 2030 (US$ Million)

Figure 37. Rest of Asia Pacific: Asia Pacific Feed Premix Market Revenue and Forecasts to 2030 (US$ Million)

Figure 38. Company Positioning & Concentration

Figure 39. Heat Map Analysis by Key Players

1. Agrifirm Group BV


2. Archer-Daniels-Midland Co

3. Cargill Inc

4. De Heus Voeders BV

5. Kemin Industries Inc

6. Koninklijke DSM NV

7. Nutreco NV

  • Save and reduce time carrying out entry-level research by identifying the growth, size, leading players, and segments in the Asia Pacific feed premix market.
  • Highlights key business priorities in order to assist companies to realign their business strategies.
  • The key findings and recommendations highlight crucial progressive industry trends in Asia Pacific feed premix market, thereby allowing players across the value chain to develop effective long-term strategies.
  • Develop/modify business expansion plans by using substantial growth offering developed and emerging markets.
  • Scrutinize in-depth Asia Pacific market trends and outlook coupled with the factors driving the feed premix market, as well as those hindering it.
  • Enhance the decision-making process by understanding the strategies that underpin security interest with respect to client products, segmentation, pricing, and distribution.
Report Code
Full Name
Country Name
Email Id
Phone Number
Job Title
Company
Requirement

Note : Your data will never be shared with third parties, however, we may send you information from time to time about our products that may be of interest to you. By submitting your details, you agree to be contacted by us. You may contact us at any time to opt-out.


Purchase Options
Single User License
$3550
$2840
Site License
$4550
$3640
Enterprise License
$5550
$4440