Analysis - by Measuring Type (Velocity Anemometers and Pressure Anemometers), Anemometers Type (Mechanical, Ultrasonic, and Others), and Application (Onshore and Offshore)
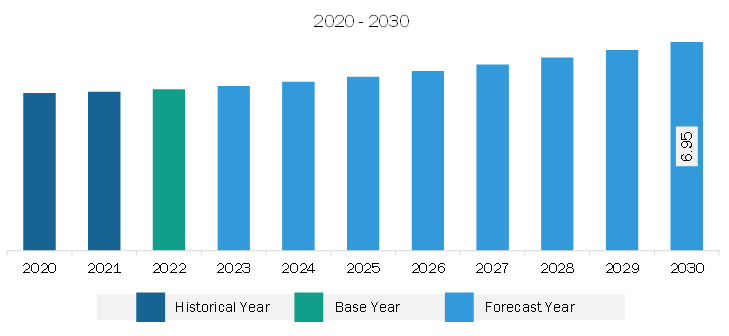
The South & Central America wind anemometer market was valued at US$ 5.38 million in 2022 and is expected to reach US$ 6.95 million by 2030; it is estimated to grow at a CAGR of 3.3% from 2022 to 2030.
Development of Offshore Wind Farms Bolsters South & Central America Wind Anemometer Market
Offshore wind power is one of the fast-growing solutions to the world's need for clean and renewable energy. Wind farm technology is advancing rapidly, with increasing attention paid to offshore wind farms placed in deep waters and away from the shore than traditional wind farms. In addition, offshore wind farms have a significantly smaller environmental footprint than fossil fuel plants and deliver no greenhouse gas emissions. They also offer an environment for marine life, with the platforms operating as artificial reefs that attract fish and other aquatic species. Before constructing offshore wind farms, developers must assess the potential locations' wind conditions. Wind anemometers are essential for accurately measuring wind speed, direction, and other environmental factors at sea, helping identify suitable and optimal locations for offshore wind turbines. This drives the demand for specialized offshore anemometer systems. Also, detailed wind resource assessments are essential to determine the energy production potential of an offshore wind farm. Wind anemometers provide the data needed to estimate the energy output, helping developers make informed investment decisions and secure financing for these large-scale projects.
Moreover, the development of offshore wind farms has driven technological and innovation advancement in the renewable energy industry, indicating improved performance and reduced costs. Once installed, offshore wind farms have lower operating costs than traditional fossil fuel plants. The governments of several countries and various companies are developing new offshore farms. Hence, with the increase in the development of offshore wind farms, the demand for wind anemometers is anticipated to grow, bolstering the wind anemometer market growth.
South & Central America Wind Anemometer Market Overview
The South & Central America wind anemometer market is segmented into Brazil, Argentina, and the Rest of South & Central America. The decrease in the production cost of offshore wind turbines is propelling the wind energy projects in South & Central America. Various countries in South & Central America are adopting wind power projects. According to the Global Wind Energy Council (GWEC), Brazil led wind power progression in Latin America using 2.3 GW of new capacity in 2020. Argentina and Chile serve to make 2020 the best year ever for wind power in the region with wind energy production. Also, according to GWEC, in 2020, Brazil ranked seventh in the world wind power ranking.
Various countries in the region are building wind farms. For instance, in April 2021, Statkraft developed a 102 MW Torsa wind power project in Chile. The developed wind project is located in the O'Higgins region, 124 km south of Santiago. The project consists of three wind farms and 19 wind turbines. Thus, the increase in wind power projects in the region propels the growth of the wind anemometer market as wind power projects have applications in wind monitoring and measuring wind direction.
South & Central America Wind Anemometer Market Revenue and Forecast to 2030 (US$ Million)
South & Central America Wind Anemometer Market Segmentation
The South & Central America wind anemometer market is segmented based on measuring type, anemometers type, applications, and country.
Based on measuring type, the South & Central America wind anemometer market is bifurcated into velocity anemometers and pressure anemometers. The velocity anemometers segment held a larger share in 2022.
Based on anemometers type, the South & Central America wind anemometer market is segmented into mechanical, ultrasonic, and others. The mechanical segment held the largest share in 2022.
In terms of applications, the South & Central America wind anemometer market is bifurcated into onshore and offshore. The onshore segment held a larger share in 2022.
Based on country, the South & Central America wind anemometer market is categorized into Brazil, Argentina, and the Rest of South & Central America. Brazil dominated the South & Central America wind anemometer market in 2022.
Vaisala Oyj, Gill Instruments Ltd, Lambrecht meteo GmbH, and Campbell Scientific Inc are some of the leading companies operating in the South & Central America wind anemometer market.
South & Central America Wind Anemometer Market Strategic Insights
Get more information on this report
South & Central America Wind Anemometer Market Segmentation Analysis
South & Central America Wind Anemometer Market Report Highlights
South & Central America Wind Anemometer Report Scope
Report Attribute
Details
Market size in 2022
US$ 5.38 Million
Market Size by 2030
US$ 6.95 Million
CAGR (2022 - 2030)
3.3%
Historical Data
2020-2021
Forecast period
2023-2030
Segments Covered
By Measuring Type
Velocity Anemometers and Pressure Anemometers
By Anemometers Type
Mechanical
Ultrasonic
By Application
Onshore and Offshore
Regions and Countries Covered
South and Central America
Brazil, Argentina, Rest of South and Central America
Market leaders and key company profiles
Vaisala Oyj
Gill Instruments Ltd
Lambrecht meteo GmbH
Campbell Scientific Inc
Get more information on this report
South & Central America Wind Anemometer Market Country and Regional Insights
Get more information on this report
Identical Market Reports with other Region/Countries
The List of Companies - South & Central America Wind Anemometer Market
1. Vaisala Oyj 2. Gill Instruments Ltd3. Lambrecht meteo GmbH4. Campbell Scientific Inc
Frequently Asked Questions
How big is the South & Central America Wind Anemometer Market?
The South & Central America Wind Anemometer Market is valued at US$ 5.38 Million in 2022, it is projected to reach US$ 6.95 Million by 2030.
What is the CAGR for South & Central America Wind Anemometer Market by (2022 - 2030)?
As per our report South & Central America Wind Anemometer Market, the market size is valued at US$ 5.38 Million in 2022, projecting it to reach US$ 6.95 Million by 2030. This translates to a CAGR of approximately 3.3% during the forecast period.
What segments are covered in this report?
The South & Central America Wind Anemometer Market report typically cover these key segments-
Measuring Type (Velocity Anemometers and Pressure Anemometers)
Anemometers Type (Mechanical, Ultrasonic)
Application (Onshore and Offshore)
What is the historic period, base year, and forecast period taken for South & Central America Wind Anemometer Market?
The historic period, base year, and forecast period can vary slightly depending on the specific market research report. However, for the South & Central America Wind Anemometer Market report:
Historic Period : 2020-2021
Base Year : 2022
Forecast Period : 2023-2030
Who are the major players in South & Central America Wind Anemometer Market?
The South & Central America Wind Anemometer Market is populated by several key players, each contributing to its growth and innovation. Some of the major players include:
Vaisala Oyj
Gill Instruments Ltd
Lambrecht meteo GmbH
Campbell Scientific Inc
Who should buy this report?
The South & Central America Wind Anemometer Market report is valuable for diverse stakeholders, including:
Investors: Provides insights for investment decisions pertaining to market growth, companies, or industry insights. Helps assess market attractiveness and potential returns.
Industry Players: Offers competitive intelligence, market sizing, and trend analysis to inform strategic planning, product development, and sales strategies.
Suppliers and Manufacturers: Helps understand market demand for components, materials, and services related to concerned industry.
Researchers and Consultants: Provides data and analysis for academic research, consulting projects, and market studies.
Financial Institutions: Helps assess risks and opportunities associated with financing or investing in the concerned market.
Essentially, anyone involved in or considering involvement in the South & Central America Wind Anemometer Market value chain can benefit from the information contained in a comprehensive market report.


 Get Free Sample For South & Central America Wind Anemometer Market


