Analysis - by Service Type (Prevention Service, Detection Service, and Incident Response Service), Enterprise Size (Large Enterprises and SMEs), Application (Network Security, Endpoint Security, Application Security, and Cloud Security), and Industry (BFSI, IT and Telecom, Manufacturing, Retail, Government and Public Sector, Healthcare, and Others)
No. of Pages:88
Report Code:
BMIRE00030292
Category:
Technology, Media and Telecommunications
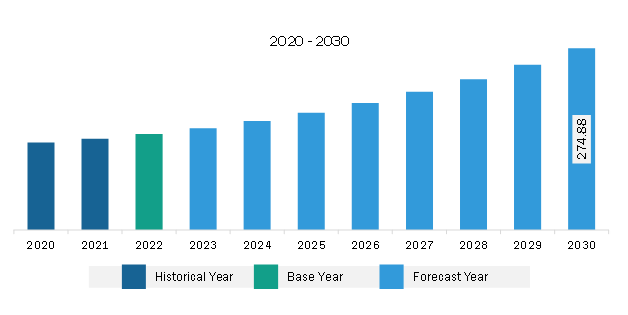
The South & Central America SOC as a service market is expected to grow from US$ 145.17 million in 2022 to US$ 274.88 million by 2030. It is estimated to register a CAGR of 8.3% from 2022 to 2030.
Growing Adoption of SOCaaS in SMEs Drives South & Central America SOC as a Service Market
Various SMEs worldwide have been facing a rise in cyberattacks in recent years. According to Accenture's Cybercrime study, small enterprises record 43% of total cyberattacks annually, of which 46% occurred in small businesses with 1,000 or fewer employees. As a result, on average, SMEs lose US$ 25,000 due to cyberattacks. In addition, in 2020, small enterprises faced over 700,000 attacks, which caused a total of US$ 2.8 billion in damages. Also, as per the World Economic Forum, ~95% of these attacks can be attributed to human error. Also, according to the Check Point, 43% of data breaches are caused by insiders or company employees, considering all cases, whether on purpose or not. Due to such increasing data breach activities, various SMEs witnessed a sharp decline in repeat customers. IBM unveiled that ~50% of small businesses require more than 24 hours to recover from an attack, as over 51% of all small businesses could not access their website for 8-24 hours. Hence, these alarming statistics raise the need for SMEs to implement cybersecurity services to help secure their businesses.
Various SMEs are investing in managed security services such as SOCaaS to meet the ever-increasing regulatory and legal requirements. Also, as SOCaaS can provide SMEs with access to a virtual security operations center (SOC), which is responsible for monitoring as well as analyzing network traffic, providing real-time alerts to security teams, and identifying security threats, its adoption is expected to increase in SMEs, creating future opportunities for the growth of the SOC as a service market.
South & Central America SOC as a Service Market Overview
The South & Central America SOC as a Service market is witnessing growth due to the growing requirement for SOC as a Service among businesses to protect data from cyberattacks. Countries such as Brazil, Argentina, Chile, and Costa Rica are the major markets for SOC as a Service in South & Central America. Growing digitalization and increasing adoption of digital technologies and infrastructure are driving the market. Various technologies such as IoT, AI, social media, and automation are highly vulnerable to cyber threats, mandating companies to adopt SOC in order to protect their confidential data. The growing number of cyberattacks in South & Central America is driving the market. For instance, Fortinet, Inc. report shows 137 billion cyberattack attempts are registered in South & Central America in 2022. The region mainly faces ransomware attempts that encrypt the company's information and prohibit system access until a ransom attacker is paid. Moreover, Mexico is a highly attracted region to cyberattacks, followed by Brazil and Colombia. Furthermore, other countries in South & Central America are also increasing their demand for SOC as a Service due to the rising cyberattacks in the region. For instance, according to INTERPOL, in April 2022, Costa Rica faced large-scale ransomware attacks initiated by a group called Conti. This attack was made from a series of interlinked attacks that hampered 27 different ministries, including the Ministry of Finance, public healthcare, and other sectors, which increased the demand and adoption of SOCs among organizations to protect their data. Thus, a growing number of cyberattacks and data breach activities are likely to create future opportunities for the SOC as a Service market in the region.
South & Central America SOC as a Service Market Revenue and Forecast to 2030 (US$ Million)
South & Central America SOC as a Service Market Segmentation
The South & Central America SOC as a service market is segmented into service type, enterprise size, application, industry, and country.
Based on service type, the South & Central America SOC as a service market is segmented into prevention service, detection service, and incident response service. The prevention service segment held the largest share of the South & Central America SOC as a service market in 2022.
In terms of enterprise size, the South & Central America SOC as a service market is bifurcated into large enterprises and SMEs. The large enterprises segment held a larger share of the South & Central America SOC as a service market in 2022.
By application, the South & Central America SOC as a service market is segmented into network security, endpoint security, application security, and cloud security. The endpoint security segment held the largest share of the South & Central America SOC as a service market in 2022.
Based on industry, the South & Central America SOC as a service market is segmented into BFSI, IT and telecom, manufacturing, retail, government and public sector, healthcare, and others. The BFSI segment held the largest share of the South & Central America SOC as a service market in 2022.
Based on country, the South & Central America SOC as a service market is segmented into Brazil, Argentina, and the Rest of South & Central America. Brazil dominated the South & Central America SOC as a service market in 2022.
AT&T Inc, Atos SE, Cloudflare Inc, Fortinet Inc, NTT Data Corp, and Thales SA are some of the leading companies operating in the South & Central America SOC as a service market.
South & Central America SOC as a Service Market Strategic Insights
Get more information on this report
South & Central America SOC as a Service Market Segmentation Analysis
South & Central America SOC as a Service Market Report Highlights
South & Central America SOC as a Service Report Scope
Report Attribute
Details
Market size in 2022
US$ 145.17 Million
Market Size by 2030
US$ 274.88 Million
CAGR (2022 - 2030)
8.3%
Historical Data
2020-2021
Forecast period
2023-2030
Segments Covered
By Service Type
Prevention Service
Detection Service
Incident Response Service
By Enterprise Size
Large Enterprises
SMEs
By Application
Network Security
Endpoint Security
Application Security
Cloud Security
By Industry
BFSI
IT and Telecom
Manufacturing
Retail
Government and Public Sector
Healthcare
Regions and Countries Covered
South and Central America
Brazil, Argentina, Rest of South and Central America
Market leaders and key company profiles
AT&T Inc
Atos SE
Cloudflare Inc
Fortinet Inc
NTT Data Corp
Thales SA
Get more information on this report
South & Central America SOC as a Service Market Country and Regional Insights
Get more information on this report
Identical Market Reports with other Region/Countries
The List of Companies - South & Central America SOC as a Service Market
1. AT&T Inc2. Atos SE3. Cloudflare Inc4. Fortinet Inc5. NTT Data Corp6. Thales SA
About Author— Technology, Media and Telecommunications Research Team
Siddhika is an experienced market research professional with over five years of expertise in delivering actionable market intelligence and strategic insights to support business growth and decision-making. She has strong experience in designing and managing end-to-end research engagements, including research planning, data collection, and insight generation.
Proficient in research methodologies, Siddhika synthesizes diverse information sources to deliver accurate, high-quality insights and strategic recommendations. She excels at translating complex market information into strategic narratives that support executive decision-making..
Show More
Frequently Asked Questions
How big is the South & Central America SOC as a Service Market?
The South & Central America SOC as a Service Market is valued at US$ 145.17 Million in 2022, it is projected to reach US$ 274.88 Million by 2030.
What is the CAGR for South & Central America SOC as a Service Market by (2022 - 2030)?
As per our report South & Central America SOC as a Service Market, the market size is valued at US$ 145.17 Million in 2022, projecting it to reach US$ 274.88 Million by 2030. This translates to a CAGR of approximately 8.3% during the forecast period.
What segments are covered in this report?
The South & Central America SOC as a Service Market report typically cover these key segments-
Service Type (Prevention Service, Detection Service, Incident Response Service)
Industry (BFSI, IT and Telecom, Manufacturing, Retail, Government and Public Sector, Healthcare)
What is the historic period, base year, and forecast period taken for South & Central America SOC as a Service Market?
The historic period, base year, and forecast period can vary slightly depending on the specific market research report. However, for the South & Central America SOC as a Service Market report:
Historic Period : 2020-2021
Base Year : 2022
Forecast Period : 2023-2030
Who are the major players in South & Central America SOC as a Service Market?
The South & Central America SOC as a Service Market is populated by several key players, each contributing to its growth and innovation. Some of the major players include:
AT&T Inc
Atos SE
Cloudflare Inc
Fortinet Inc
NTT Data Corp
Thales SA
Who should buy this report?
The South & Central America SOC as a Service Market report is valuable for diverse stakeholders, including:
Investors: Provides insights for investment decisions pertaining to market growth, companies, or industry insights. Helps assess market attractiveness and potential returns.
Industry Players: Offers competitive intelligence, market sizing, and trend analysis to inform strategic planning, product development, and sales strategies.
Suppliers and Manufacturers: Helps understand market demand for components, materials, and services related to concerned industry.
Researchers and Consultants: Provides data and analysis for academic research, consulting projects, and market studies.
Financial Institutions: Helps assess risks and opportunities associated with financing or investing in the concerned market.
Essentially, anyone involved in or considering involvement in the South & Central America SOC as a Service Market value chain can benefit from the information contained in a comprehensive market report.


 Get Free Sample For South & Central America SOC as a Service Market


