توقعات سوق المركبات المتصلة في أمريكا الجنوبية والوسطى حتى عام 2030 - التحليل الإقليمي - حسب التكنولوجيا (5G، 4G/LTE، و3G و2G)، والاتصال (المتكامل والمقيد والمضمن)، والتطبيق (تقنية المعلومات والترفيه، ومساعدة القيادة، و آحرون)
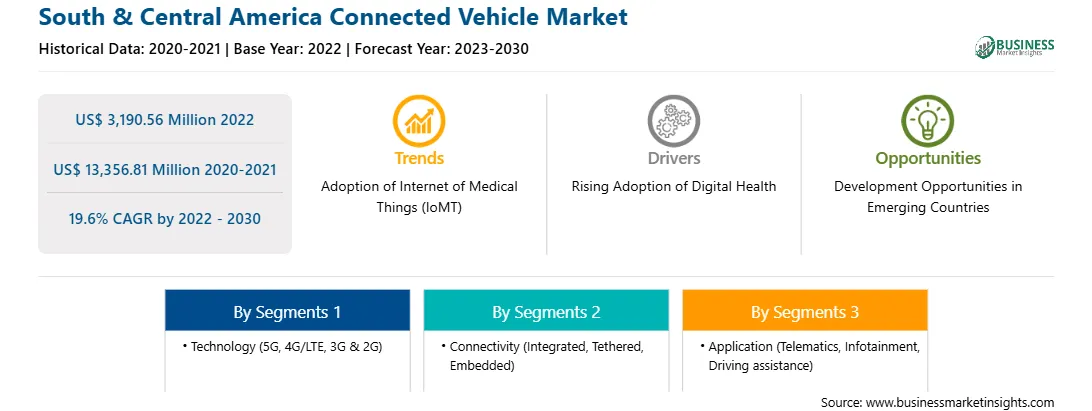
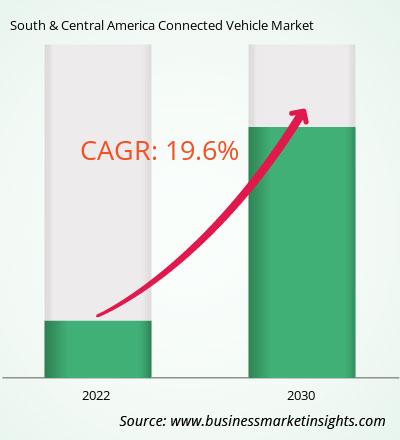
بلغت قيمة سوق المركبات المتصلة في أمريكا الجنوبية والوسطى 3,190.56 مليون دولار أمريكي في عام 2022، ومن المتوقع أن تصل إلى 13,356.81 مليون دولار أمريكي بحلول عام 2030؛ ومن المقدر أن تسجل معدل نمو سنوي مركب قدره 19.6% من عام 2022 إلى عام 2030.
زيادة مبادرات المدن الذكية تدفع سوق المركبات المتصلة بأمريكا الجنوبية والوسطى
تأثير المدن الذكية وتطوير البنية التحتية على الطلب من المتوقع أن يحدث تحول في سوق المركبات المتصلة في السنوات القادمة. مع استمرار المدن في جميع أنحاء العالم في التطور إلى مراكز حضرية ذكية تعتمد على التكنولوجيا، فإن التآزر بين هذه التطورات وسوق المركبات المتصلة من شأنه أن يشكل مستقبل التنقل الحضري. يؤدي التركيز المتزايد على مبادرات المدن المبتكرة إلى دفع الاستثمارات في البنية التحتية التي تدعم المركبات المتصلة. تشمل هذه الاستثمارات نشر أجهزة الاستشعار وشبكات البيانات وأنظمة إدارة حركة المرور في الوقت الفعلي التي تنشئ نظامًا بيئيًا غنيًا للبيانات الملائمة لصناعة المركبات المتصلة. ومع إعطاء المدن الذكية الأولوية بشكل متزايد للاستدامة البيئية، فمن المتوقع أن يرتفع الطلب على المركبات المتصلة، وخاصة النماذج الكهربائية والهجينة. تعمل هذه المدن بنشاط على تعزيز خيارات النقل الصديقة للبيئة لتقليل الانبعاثات ومكافحة التلوث. وتلعب المركبات المتصلة دورًا محوريًا في هذا المسعى من خلال تقديم ميزات مثل إدارة الطاقة، والتشخيص عن بعد، والشحن الأمثل، وكلها تساهم في نظام بيئي للنقل الحضري أكثر خضرة واستدامة. ومع استمرار المدن في التحفيز والاستثمار في حلول التنقل الخضراء، من المتوقع أن ينمو طلب السوق على المركبات المتصلة ذات الميزات الصديقة للبيئة بشكل كبير. نظرة عامة على سوق المركبات المتصلة في أمريكا الجنوبية والوسطى
تعد صناعة السيارات في أمريكا الجنوبية قطاعًا ديناميكيًا ومتطورًا يتميز بمجموعة واسعة من المركبات، بدءًا من السيارات الصغيرة وحتى المركبات الوعرة للطرق الوعرة. وسط هذا المشهد المتنوع، تبرز صناعة السيارات المتصلة كعامل تغيير لقواعد اللعبة، حيث لا تعزز تجربة القيادة فحسب، بل تساهم أيضًا في تحقيق الأهداف الاقتصادية والبيئية للمنطقة. البرازيل هي أكبر سوق للسيارات في أمريكا الجنوبية. تقوم شركات صناعة السيارات البرازيلية بدمج أنظمة المعلوماتية المتقدمة وميزات المعلومات والترفيه في سياراتها، مما يسمح للمستهلكين بالبقاء على اتصال أثناء السير على الطريق. ومع التركيز على تعزيز تجربة القيادة الشاملة، يختار المستهلكون الأرجنتينيون بشكل متزايد المركبات المجهزة بميزات الاتصال المتقدمة، مثل تكامل الهاتف الذكي وإدارة المركبات عن بعد.
إيرادات سوق المركبات المتصلة في أمريكا الجنوبية والوسطى والتوقعات حتى عام 2030 (مليون دولار أمريكي)
تجزئة سوق المركبات المتصلة في أمريكا الجنوبية والوسطى
المركبات المتصلة في أمريكا الجنوبية والوسطى يتم تقسيم السوق بناءً على التكنولوجيا والاتصال والتطبيق والبلد. استنادًا إلى التكنولوجيا، يتم تصنيف سوق المركبات المتصلة في أمريكا الجنوبية والوسطى إلى 5G، و4G/LTE، و3G و2G. استحوذ قطاع 4G/LTE على أكبر حصة سوقية في عام 2022.
فيما يتعلق بالاتصال، ينقسم سوق المركبات المتصلة في أمريكا الجنوبية والوسطى إلى متكاملة ومربوطة ومدمجة. استحوذ القطاع المتكامل على أكبر حصة سوقية في عام 2022.
حسب التطبيق، يتم تصنيف سوق المركبات المتصلة في أمريكا الجنوبية والوسطى إلى تكنولوجيا المعلومات والترفيه والمعلومات والمساعدة في القيادة وغيرها. استحوذ قطاع المعلومات والترفيه على أكبر حصة سوقية في عام 2022.
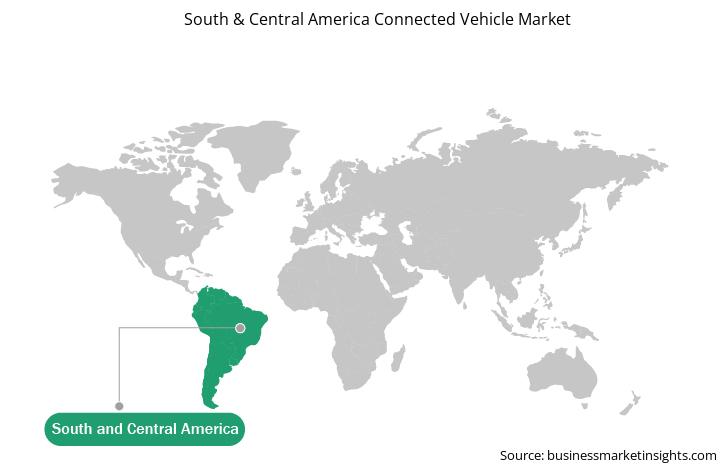
استنادًا إلى البلد، تم تقسيم سوق المركبات المتصلة في أمريكا الجنوبية والوسطى إلى البرازيل والأرجنتين وبقية أمريكا الجنوبية والوسطى. سيطرت البرازيل على حصة سوق المركبات المتصلة بأمريكا الجنوبية والوسطى في عام 2022.
AT & T، Audi AG، Bayerische Motoren Werke AG، Continental AG، Denso، General Motors Co، Harman International Industries Inc، Robert Bosch GmbH، تعد Visteon Corp وVodafone Group Plc من الشركات الرائدة العاملة في سوق المركبات المتصلة بأمريكا الجنوبية والوسطى.
South & Central America Connected Vehicle Strategic Insights
Strategic insights for South & Central America Connected Vehicle involve closely monitoring industry trends, consumer behaviours, and competitor actions to identify opportunities for growth. By leveraging data analytics, businesses can anticipate market shifts and make informed decisions that align with evolving customer needs. Understanding these dynamics helps companies adjust their strategies proactively, enhance customer engagement, and strengthen their competitive edge. Building strong relationships with stakeholders and staying agile in response to changes ensures long-term success in any market.
Get more information on this report
South & Central America Connected Vehicle Report Scope
South & Central America Connected Vehicle Regional Insights
The regional scope of South & Central America Connected Vehicle refers to the geographical area in which a business operates and competes. Understanding regional nuances, such as local consumer preferences, economic conditions, and regulatory environments, is crucial for tailoring strategies to specific markets. Businesses can expand their reach by identifying underserved regions or adapting their offerings to meet regional demands. A clear regional focus allows for more effective resource allocation, targeted marketing, and better positioning against local competitors, ultimately driving growth in those specific areas.
Get more information on this report
Identical Market Reports with other Region/Countries
The List of Companies - South & Central America Connected Vehicle Market
1. AT & T
2. Audi AG
3. Bayerische Motoren Werke AG
4. Continental AG
5. Denso
6. General Motors Co
7. Harman International Industries Inc
8. Robert Bosch GmbH
9. Visteon Corp
10. Vodafone Group Plc
Frequently Asked Questions
How big is the South & Central America Connected Vehicle Market?
The South & Central America Connected Vehicle Market is valued at US$ 3,190.56 Million in 2022, it is projected to reach US$ 13,356.81 Million by 2030.
What is the CAGR for South & Central America Connected Vehicle Market by (2022 - 2030)?
As per our report South & Central America Connected Vehicle Market, the market size is valued at US$ 3,190.56 Million in 2022, projecting it to reach US$ 13,356.81 Million by 2030. This translates to a CAGR of approximately 19.6% during the forecast period.
What segments are covered in this report?
The South & Central America Connected Vehicle Market report typically cover these key segments-
التكنولوجيا (5G، 4G/LTE، 3G و 2G)
الاتصال (متكامل، مربوط، مضمن)
التطبيقات (المعلوماتية، الترفيه المعلوماتي، مساعدة القيادة)
What is the historic period, base year, and forecast period taken for South & Central America Connected Vehicle Market?
The historic period, base year, and forecast period can vary slightly depending on the specific market research report. However, for the South & Central America Connected Vehicle Market report:
Historic Period : 2020-2021
Base Year : 2022
Forecast Period : 2023-2030
Who are the major players in South & Central America Connected Vehicle Market?
The South & Central America Connected Vehicle Market is populated by several key players, each contributing to its growth and innovation. Some of the major players include:
AT & T
Audi AG
Bayerische Motoren Werke AG
Continental AG
Denso
General Motors Co
Harman International Industries Inc
Robert Bosch GmbH
Visteon Corp
Vodafone Group Plc
Who should buy this report?
The South & Central America Connected Vehicle Market report is valuable for diverse stakeholders, including:
Investors: Provides insights for investment decisions pertaining to market growth, companies, or industry insights. Helps assess market attractiveness and potential returns.
Industry Players: Offers competitive intelligence, market sizing, and trend analysis to inform strategic planning, product development, and sales strategies.
Suppliers and Manufacturers: Helps understand market demand for components, materials, and services related to concerned industry.
Researchers and Consultants: Provides data and analysis for academic research, consulting projects, and market studies.
Financial Institutions: Helps assess risks and opportunities associated with financing or investing in the concerned market.
Essentially, anyone involved in or considering involvement in the South & Central America Connected Vehicle Market value chain can benefit from the information contained in a comprehensive market report.
Get Free Sample For South & Central America Connected Vehicle Market
1. Complete the form
2. Check your inbox (and spam/junk folder)
3. Your Personal Data is Secure with us
GDPR + CCPA Compliant
Personal & transactional information is kept safe from unauthorized use.
WHAT'S INCLUDED IN FULL REPORT : Market Dynamics,
Competitive Analysis and Assessment, Define Business Strategies, Market Outlook and
Trends, Market Size and Share Analysis, Growth Driving Factors, Future Commercial
Potential, Identify Regional Growth Engines


 Get Free Sample For South & Central America Connected Vehicle Market

