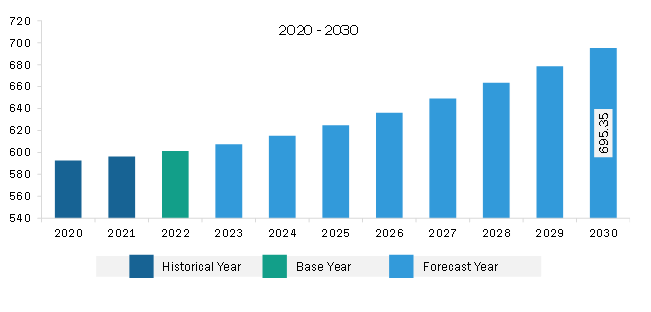
تدفع التروس الدودية في أمريكا الشمالية توقعات السوق حتى عام 2030 - التحليل الإقليمي - حسب نوع العملية (التروس الدودية الأسطوانية والعتاد الدودي المغلف الفردي والمزدوج)، ونوع المنتج (الوحدات المبيتة، ومجموعات التروس، والديدان عالية السرعة)، ونوع المادة (الفولاذ المقاوم للصدأ، الحديد الزهر والألومنيوم وغيرها)

BMIRE00030531 | Pages: 71 | Manufacturing and Construction | Jul 2024 | Type: Regional | Status: Published
بلغت قيمة سوق محركات التروس الدودية في أمريكا الشمالية 601.23 مليون دولار أمريكي في عام 2022 ومن المتوقع أن تصل إلى 695.35 مليون دولار أمريكي بحلول عام 2030؛ ومن المقدر أن تسجل معدل نمو سنوي مركب بنسبة 1.8% من عام 2022 إلى عام 2030.

زيادة مبيعات السيارات على مستوى العالم تغذي سوق محركات التروس الدودية في أمريكا الشمالية

تُستخدم محركات التروس الدودية على نطاق واسع في أنظمة التوجيه والمقاعد الكهربائية. والأسطح القابلة للتحويل وفتحات السقف وأنظمة التدفئة والتهوية وتكييف الهواء، من بين قطع غيار السيارات الأخرى. في أنظمة التوجيه، تُستخدم محركات التروس الدودية في تصميمات الجريدة المسننة والترس. يقوم محرك الترس الدودي بتحويل الحركة الدائرية لعجلة القيادة إلى الحركة الخطية التي يتطلبها نظام التوجيه. تعتبر ميزة القفل الذاتي لمحركات التروس الدودية مفيدة لأنظمة التوجيه، حيث تساعد في الحفاظ على استقرار النظام وفي الموضع المناسب. تُستخدم محركات التروس الدودية أيضًا في تعديلات المقعد الكهربائي لضمان الحركة السلسة والمتحكم فيها. إنها توفر عزم الدوران والدقة المطلوبة لتعديل موضع المقعد وزاوية الاستلقاء والارتفاع وفقًا لمواصفات السائقين. تُستخدم محركات التروس الدودية في أنظمة التدفئة والتهوية وتكييف الهواء (HVAC) في المركبات لإدارة تدفق الهواء ودرجة الحرارة. تساعد هذه التروس في تعديل أبواب مزيج الهواء وأغطية إعادة التدوير، مما يؤدي إلى إدارة المناخ بكفاءة داخل السيارات. تؤثر زيادة إنتاج المركبات ومبيعاتها بشكل مباشر على الطلب على أنظمة التوجيه وأنظمة التدفئة والتهوية وتكييف الهواء والمقاعد الكهربائية، مما يؤدي في النهاية إلى مبيعات محركات التروس الدودية. وفقًا للبيانات التي نشرتها المنظمة الدولية لمصنعي السيارات في عام 2023، تم بيع 57 مليون سيارة ركاب في عام 2022 على مستوى العالم، بزيادة قدرها مليون وحدة عن عام 2021. ودول مثل الولايات المتحدة وألمانيا والصين والهند على سبيل المثال لا الحصر. من أهم أسواق صناعة السيارات. وفقًا لجمعية السيارات الأمريكية، يمثل قطاع تصنيع السيارات 11% من الناتج المحلي الإجمالي للولايات المتحدة في عام 2022. وتمتلك الولايات المتحدة ثامن أكبر صناعة لتصنيع السيارات في العالم، والتي تدر تريليون دولار أمريكي سنويًا للاقتصاد الأمريكي. ويمثل تصنيع قطع غيار السيارات والمركبات 3% من الناتج المحلي الإجمالي للولايات المتحدة، وفقًا لتقرير تحالف ابتكارات السيارات لعام 2022. وقدرت قيمة قطاع تصنيع السيارات والسيارات في الولايات المتحدة بنحو 104.1 مليار دولار أمريكي في عام 2023. وفي عام 2021، تم إنتاج ما يقرب من 9.2 مليون مركبة تم إنتاجها في البلاد، مسجلة زيادة بنسبة 4.5٪ مقارنة بعام 2020. وقد أدى ارتفاع إنتاج المركبات إلى خلق طلب هائل على منتجات وخدمات السيارات. أيضًا، وفقًا لتقرير جمعية مصنعي السيارات الهندية (SIAM)، وصل إنتاج السيارات في الهند إلى 5.45 مليون وحدة في عام 2022، مقارنة بـ 4.4 مليون وحدة تم إنتاجها في عام 2021.

مثل هذه الزيادة في إنتاج المركبات حول العالم يقود نمو سوق تكنولوجيا المعلومات للسيارات. يوضح الرسم البياني التالي إنتاج السيارات حسب الدول والمناطق الرئيسية في عام 2022 وفقًا لتقرير منظمة رابطة مصنعي السيارات الأوروبية.

لقد أثر الطلب المتزايد على المركبات على الإنتاج العالمي من المركبات بشكل إيجابي. أدت زيادة إنتاج المركبات إلى زيادة الطلب على محركات التروس الدودية في صناعة السيارات، مما أدى في النهاية إلى دفع السوق. نظرة عامة على سوق محركات التروس الدودية في أمريكا الشمالية

يُظهر سوق محركات التروس الدودية في أمريكا الشمالية مشهدًا متنوعًا وديناميكيًا، متأثرًا بمساهمات الولايات المتحدة وكندا والمكسيك. تعد الولايات المتحدة، بقطاعها الصناعي القوي، عامل تمكين رئيسي للمعدات الدودية التي تدفع نمو السوق. وانتعشت أحجام التجارة، وهي مؤشر رئيسي للصحة الاقتصادية، في عامي 2021 و2022 بعد أن واجهت انتكاسة في عامي 2019 و2020 بسبب التعديلات في السياسات التجارية وسط جائحة كوفيد-19. يتماشى انتعاش القيم التجارية مع انتعاش صادرات السلع المصنعة الأمريكية، حيث وصلت إلى أعلى مستوى لها على الإطلاق عند 1,596.79 مليار دولار أمريكي في عام 2022. وحققت صادرات السلع المعمرة وغير المعمرة مستويات قياسية، حيث بلغت 970.97 مليار دولار أمريكي و625.82 مليار دولار أمريكي. على التوالى.

مع إرث قوي من تصنيع السيارات عالية الجودة، تستضيف كندا كبار مصنعي المعدات الأصلية مثل Stellantis وFord وGM وHonda وToyota، مما يؤدي إلى إنشاء قطاع سيارات مزدهر. الطلب على محركات التروس الدودية مدفوع بالنظام البيئي للتصنيع، بما في ذلك شبكة تضم ما يقرب من 700 مورد لقطع الغيار. ومع الدور الذي تلعبه المكسيك باعتبارها مصدرا رئيسيا للسيارات إلى الأسواق العالمية، أصبحت جودة وكفاءة عمليات التصنيع ذات أهمية قصوى، مما يغذي السوق لأنظمة نقل الطاقة المتقدمة.

التروس الدودية في أمريكا الشمالية تدفع إيرادات السوق والتوقعات حتى عام 2030 (مليون دولار أمريكي)

تدفع التروس الدودية في أمريكا الشمالية إلى تجزئة السوق

يتم تصنيف سوق محركات التروس الدودية في أمريكا الشمالية في نوع العملية، نوع المنتج، نوع المادة، والبلد.

استنادًا إلى نوع العملية، ينقسم سوق محركات التروس الدودية في أمريكا الشمالية إلى تروس دودية أسطوانية وتروس دودية ذات غلاف فردي ومزدوج. استحوذ قطاع التروس الدودية الأسطوانية على حصة سوقية أكبر في عام 2022.

من حيث نوع المنتج، يتم تصنيف سوق محركات التروس الدودية في أمريكا الشمالية إلى وحدات مبيت ومجموعات تروس ودودة عالية السرعة. استحوذ قطاع مجموعات التروس على أكبر حصة سوقية في عام 2022.

حسب نوع المادة، يتم تقسيم سوق محركات التروس الدودية في أمريكا الشمالية إلى الفولاذ المقاوم للصدأ والحديد الزهر والألومنيوم وغيرها. استحوذ قطاع الفولاذ المقاوم للصدأ على أكبر حصة سوقية في عام 2022.

حسب البلد، يتم تقسيم سوق محركات التروس الدودية في أمريكا الشمالية إلى الولايات المتحدة وكندا والمكسيك. سيطرت الولايات المتحدة على حصة سوق محركات التروس الدودية في أمريكا الشمالية في عام 2022. من الشركات الرائدة العاملة في سوق محركات التروس الدودية في أمريكا الشمالية.

TABLE OF CONTENTS


1. Introduction

1.1 The Insight Partners Research Report Guidance

1.2 Market Segmentation

2. Executive Summary

2.1 Key Insights

2.2 Market Attractiveness

3. Research Methodology

3.1 Coverage

3.2 Secondary Research

3.3 Primary Research

4. North America Worm Gear Drives Market Landscape

4.1 Overview

4.2 Ecosystem Analysis

5. North America Worm Gear Drives Market - Key Market Dynamics

5.1 Market Drivers

5.1.1 Increased Automotive Sales Globally

5.1.2 Growing Elevator and Escalator Installations Due to Increasing Construction Activities

5.2 Market Restraints

5.2.1 Presence of Alternative Products

5.3 Market Opportunities

5.3.1 Rise in Adoption of Robotics

5.4 Future Trends

5.4.1 Advancements in Worm Gear Manufacturing

5.5 Impact of Drivers and Restraints:

6. Worm Gear Drives Market - North America Market Analysis

6.1 Worm Gear Drives Market Revenue (US$ Million), 2020-2030

6.2 Worm Gear Drives Market Forecast Analysis

7. North America Worm Gear Drives Market Analysis - by Operation Type

7.1 Cylindrical Worm Gear

7.1.1 Overview

7.1.2 Cylindrical Worm Gear: Worm Gear Drives Market - Revenue and Forecast to 2030 (US$ Million)

7.2 Single and Double Enveloping Worm Gear

7.2.1 Overview

7.2.2 Single and Double Enveloping Worm Gear: Worm Gear Drives Market - Revenue and Forecast to 2030 (US$ Million)

8. North America Worm Gear Drives Market Analysis - by Product Type

8.1 Housed Units

8.1.1 Overview

8.1.2 Housed Units: Worm Gear Drives Market - Revenue and Forecast to 2030 (US$ Million)

8.2 Gearsets

8.2.1 Overview

8.2.2 Gearsets: Worm Gear Drives Market - Revenue and Forecast to 2030 (US$ Million)

8.3 High Speed Worms

8.3.1 Overview

8.3.2 High Speed Worms: Worm Gear Drives Market - Revenue and Forecast to 2030 (US$ Million)

9. North America Worm Gear Drives Market Analysis - by Material Type

9.1 Stainless Steel

9.1.1 Overview

9.1.2 Stainless Steel: Worm Gear Drives Market - Revenue and Forecast to 2030 (US$ Million)

9.2 Cast Iron

9.2.1 Overview

9.2.2 Cast Iron: Worm Gear Drives Market - Revenue and Forecast to 2030 (US$ Million)

9.3 Aluminum

9.3.1 Overview

9.3.2 Aluminum: Worm Gear Drives Market - Revenue and Forecast to 2030 (US$ Million)

9.4 Others

9.4.1 Overview

9.4.2 Others: Worm Gear Drives Market - Revenue and Forecast to 2030 (US$ Million)

10. North America Worm Gear Drives Market - Country Analysis

10.1 North America: Worm Gear Drives Market - Revenue and Forecast Analysis - by Country

10.1.1 North America: Worm Gear Drives Market - Revenue and Forecast Analysis - by Country

10.1.2 United States: Worm Gear Drives Market - Revenue and Forecast to 2030 (US$ Million)

10.1.2.1 United States: Worm Gear Drives Market Breakdown, by Operation Type

10.1.2.2 United States: Worm Gear Drives Market Breakdown, by Product Type

10.1.2.3 United States: Worm Gear Drives Market Breakdown, by Material Type

10.1.3 Canada: Worm Gear Drives Market - Revenue and Forecast to 2030 (US$ Million)

10.1.3.1 Canada: Worm Gear Drives Market Breakdown, by Operation Type

10.1.3.2 Canada: Worm Gear Drives Market Breakdown, by Product Type

10.1.3.3 Canada: Worm Gear Drives Market Breakdown, by Material Type

10.1.4 Mexico: Worm Gear Drives Market - Revenue and Forecast to 2030 (US$ Million)

10.1.4.1 Mexico: Worm Gear Drives Market Breakdown, by Operation Type

10.1.4.2 Mexico: Worm Gear Drives Market Breakdown, by Product Type

10.1.4.3 Mexico: Worm Gear Drives Market Breakdown, by Material Type

11. Competitive Landscape

11.1 Heat Map Analysis

11.2 Company Positioning & Concentration

12. Industry Landscape

12.1 Overview

12.2 Market Initiative

12.3 Product Development

13. Company Profiles

13.1 Kohara Gear Industry Co Ltd

13.1.1 Key Facts

13.1.2 Business Description

13.1.3 Products and Services

13.1.4 Financial Overview

13.1.5 SWOT Analysis

13.1.6 Key Developments

13.2 Boston Gear LLC

13.2.1 Key Facts

13.2.2 Business Description

13.2.3 Products and Services

13.2.4 Financial Overview

13.2.5 SWOT Analysis

13.2.6 Key Developments

13.3 Delroyd Worm Gear LLC

13.3.1 Key Facts

13.3.2 Business Description

13.3.3 Products and Services

13.3.4 Financial Overview

13.3.5 SWOT Analysis

13.3.6 Key Developments

13.4 Tulsa Winch Inc

13.4.1 Key Facts

13.4.2 Business Description

13.4.3 Products and Services

13.4.4 Financial Overview

13.4.5 SWOT Analysis

13.4.6 Key Developments

13.5 Cleveland Gear Co Inc

13.5.1 Key Facts

13.5.2 Business Description

13.5.3 Products and Services

13.5.4 Financial Overview

13.5.5 SWOT Analysis

13.5.6 Key Developments

13.6 The Timken Co

13.6.1 Key Facts

13.6.2 Business Description

13.6.3 Products and Services

13.6.4 Financial Overview

13.6.5 SWOT Analysis

13.6.6 Key Developments

14. Appendix

14.1 About The Insight Partners

List of Tables

Table 1. Worm Gear Drives Market Segmentation

Table 2. Worm Gear Drives Market - Revenue and Forecast to 2030 (US$ Million)

Table 3. Worm Gear Drives Market - Revenue and Forecast to 2030 (US$ Million) - by Operation Type

Table 4. Worm Gear Drives Market - Revenue and Forecast to 2030 (US$ Million) - by Product Type

Table 5. Worm Gear Drives Market - Revenue and Forecast to 2030 (US$ Million) - by Material Type

Table 6. North America: Worm Gear Drives Market - Revenue and Forecast to 2030(US$ Million) - by Country

Table 7. United States: Worm Gear Drives Market - Revenue and Forecast to 2030(US$ Million) - by Operation Type

Table 8. United States: Worm Gear Drives Market - Revenue and Forecast to 2030(US$ Million) - by Product Type

Table 9. United States: Worm Gear Drives Market - Revenue and Forecast to 2030(US$ Million) - by Material Type

Table 10. Canada: Worm Gear Drives Market - Revenue and Forecast to 2030(US$ Million) - by Operation Type

Table 11. Canada: Worm Gear Drives Market - Revenue and Forecast to 2030(US$ Million) - by Product Type

Table 12. Canada: Worm Gear Drives Market - Revenue and Forecast to 2030(US$ Million) - by Material Type

Table 13. Mexico: Worm Gear Drives Market - Revenue and Forecast to 2030(US$ Million) - by Operation Type

Table 14. Mexico: Worm Gear Drives Market - Revenue and Forecast to 2030(US$ Million) - by Product Type

Table 15. Mexico: Worm Gear Drives Market - Revenue and Forecast to 2030(US$ Million) - by Material Type

List of Figures

Figure 1. Worm Gear Drives Market Segmentation, by Country

Figure 2. Worm Gear Drives Market - Key Market Dynamics

Figure 3. Impact Analysis of Drivers and Restraints

Figure 4. Worm Gear Drives Market Revenue (US$ Million), 2020-2030

Figure 5. Worm Gear Drives Market Share (%) - by Operation Type (2022 and 2030)

Figure 6. Cylindrical Worm Gear: Worm Gear Drives Market - Revenue and Forecast to 2030 (US$ Million)

Figure 7. Single and Double Enveloping Worm Gear: Worm Gear Drives Market - Revenue and Forecast to 2030 (US$ Million)

Figure 8. Worm Gear Drives Market Share (%) - by Product Type (2022 and 2030)

Figure 9. Housed Units: Worm Gear Drives Market - Revenue and Forecast to 2030 (US$ Million)

Figure 10. Gearsets: Worm Gear Drives Market - Revenue and Forecast to 2030 (US$ Million)

Figure 11. High Speed Worms: Worm Gear Drives Market - Revenue and Forecast to 2030 (US$ Million)

Figure 12. Worm Gear Drives Market Share (%) - by Material Type (2022 and 2030)

Figure 13. Stainless Steel: Worm Gear Drives Market - Revenue and Forecast to 2030 (US$ Million)

Figure 14. Cast Iron: Worm Gear Drives Market - Revenue and Forecast to 2030 (US$ Million)

Figure 15. Aluminum: Worm Gear Drives Market - Revenue and Forecast to 2030 (US$ Million)

Figure 16. Others: Worm Gear Drives Market - Revenue and Forecast to 2030 (US$ Million)

Figure 17. North America Worm Gear Drives Market, by Key Countries - Revenue (2022) (US$ Million)

Figure 18. North America: Worm Gear Drives Market Breakdown, by Key Countries, 2022 and 2030 (%)

Figure 19. United States: Worm Gear Drives Market - Revenue and Forecast to 2030(US$ Million)

Figure 20. Canada: Worm Gear Drives Market - Revenue and Forecast to 2030(US$ Million)

Figure 21. Mexico: Worm Gear Drives Market - Revenue and Forecast to 2030(US$ Million)

Figure 22. Heat Map Analysis, by Key Players

Figure 23. Company Positioning & Concentration

1. Kohara Gear Industry Co Ltd.
2. Boston Gear LLC.
3. Delroyd Worm Gear LLC.
4. Tulsa Winch Inc.
5. Cleveland Gear Co Inc.
6. The Timken Co.

  • Save and reduce time carrying out entry-level research by identifying the growth, size, leading players, and segments in the North America worm gear drives market.
  •  
  • Highlights key business priorities in order to assist companies to realign their business strategies.
  •  
  • The key findings and recommendations highlight crucial progressive industry trends in the North America worm gear drives market, thereby allowing players across the value chain to develop effective long-term strategies.
  •  
  • Develop/modify business expansion plans by using substantial growth offering developed and emerging markets.
  •  
  • Scrutinize in-depth North America market trends and outlook coupled with the factors driving the North America worm gear drives market, as well as those hindering it.
  •  
  • Enhance the decision-making process by understanding the strategies that underpin commercial interest with respect to client products, segmentation, pricing, and distribution.
Report Code
Full Name
Country Name
Email Id
Phone Number
Job Title
Company
Requirement

Note : Your data will never be shared with third parties, however, we may send you information from time to time about our products that may be of interest to you. By submitting your details, you agree to be contacted by us. You may contact us at any time to opt-out.


Purchase Options
Single User License
$3550
$2840
Site License
$4550
$3640
Enterprise License
$5550
$4440