توقعات سوق التذاكر الذكية في أمريكا الشمالية حتى عام 2031 – تحليل إقليمي – حسب المكون (الأجهزة والبرامج والخدمات)، ونظام الدفع (نظام الدفع المفتوح والبطاقة الذكية وتقنية الاتصال قريب المدى)، والمستخدم النهائي (النقل والرياضة والترفيه ومواقف السيارات وغيرها)
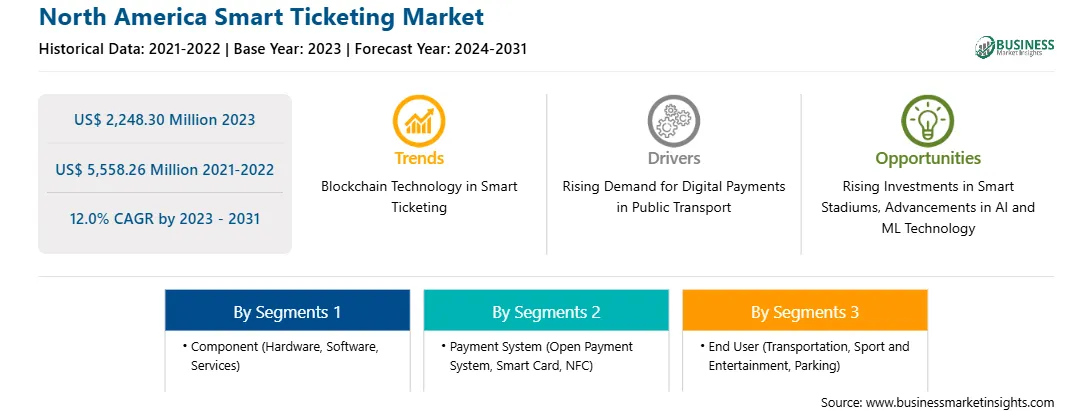
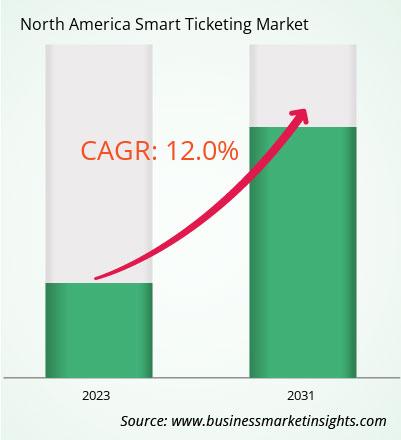
تم تقييم سوق التذاكر الذكية في أمريكا الشمالية بمبلغ 2،248.30 مليون دولار أمريكي في عام 2023 ومن المتوقع أن يصل إلى 5،558.26 مليون دولار أمريكي بحلول عام 2031؛ ومن المتوقع أن يسجل معدل نمو سنوي مركب بنسبة 12.0٪ من عام 2023 إلى عام 2031.
الطلب المتزايد على المدفوعات الرقمية في وسائل النقل العام يغذي سوق التذاكر الذكية في أمريكا الشمالية
تقدم المدن الحديثة مجموعة متنوعة من خيارات النقل، مثل الحافلات والقطارات والمترو. كل نظام نقل عام لديه نظام التذاكر الخاص به. قد تكون إدارة بطاقات ذكية متعددة أو تطبيقات لوسائل النقل المختلفة أمرًا مرهقًا للمسافرين. هناك حاجة إلى طريقة مركزية للجمع بين جميع شبكات النقل. في هذا الاتجاه، يتم ترقية البنية التحتية للنقل العام في جميع أنحاء العالم. تهدف الترقيات أيضًا إلى تحسين تجربة الركاب من خلال واجهة دفع سلسة. على سبيل المثال، في عام 2024، حصلت شركة إندرا على عقد بقيمة 16 مليون دولار أمريكي لتجديد آلات بيع التذاكر لشركة بي ستيت للتنمية، وهي الوكالة العامة بين الولايات التي تدير خدمات النقل العام في منطقة سانت لويس الحضرية، وميترو لينك، شبكة السكك الحديدية الخفيفة الأمريكية في ميسوري وإلينوي. يغطي العقد تصميم وإنتاج وتسليم آلات بيع جديدة ومتطورة لمحطات شبكة مترو سانت لويس البالغ عددها 38 محطة. ستحل هذه الآلات محل الآلات المستخدمة حاليًا والتي سلمتها إندرا سابقًا بين عامي 2006 و2012. ستكون إندرا أيضًا مسؤولة عن صيانة الآلات ووضع نظام إدارة قائم على السحابة لتتبعها وإدارتها. مع تطور المدن إلى بيئات ذكية ومتصلة ورقمية في المقام الأول، ستظل المدفوعات الرقمية لخدمات النقل العام في طليعة الأجندة، وبالتالي دفع نمو سوق التذاكر الذكية.
نظرة عامة على سوق التذاكر الذكية في أمريكا الشمالية
يشهد سوق التذاكر الذكية في أمريكا الشمالية نموًا كبيرًا بسبب التطورات في تكنولوجيا البطاقات الذكية المستخدمة في أنظمة التذاكر الذكية. تكتسب الحلول غير التلامسية التي تسهلها الهواتف الذكية والأجهزة القابلة للارتداء المتطورة قوة جذب كبيرة، حيث تساعد هذه الحلول في تحسين الوقت والحد من الاحتكاك في مكاتب التذاكر المادية مع خيارات دفع مرنة. قدمت شركات تصنيع الأجهزة القابلة للارتداء الذكية البارزة، مثل Samsung، إمكانيات الدفع في ساعاتها الذكية. بالإضافة إلى ذلك، تقوم معظم شركات تصنيع الأجهزة بدمج خدمات الدفع، بما في ذلك Samsung Pay وFitbit Pay وApple Pay وGarmin Pay وGoogle Pay، في عروض محافظ الهاتف المحمول الخاصة بها. في حين أن المدفوعات التي تدعمها الساعات الذكية لا تزال في مرحلة التطوير، إلا أنها تتمتع بإمكانات سوقية كبيرة. ومن المتوقع أن تمكن هذه التطورات المستهلكين من شراء التذاكر باستخدام أجهزتهم القابلة للارتداء، مما يعكس تحولًا ملحوظًا في مشهد التذاكر. بالإضافة إلى ذلك، فإن المبادرات التي اتخذتها الجهات الفاعلة الرئيسية في سوق التذاكر الذكية، مثل Cubic Corporation، تصب في صالح السوق بشكل إيجابي.
على سبيل المثال، في مايو 2023، سهّلت خطوة CALYPSO من Infineon تطوير حلول التذاكر المتوافقة التي تلتزم بالمعايير المفتوحة، مما مكّن الشركات المصنعة من تصميم حلول للاحتياجات الفريدة لمشغلي النقل والسلطات. يلغي هذا النهج الاعتماد على الأشرطة المغناطيسية والرموز الشريطية والتذاكر الملكية، مما يضمن مرونة وتوافقًا أكبر عبر الأنظمة المتنوعة. يمثل هذا التطور خطوة كبيرة إلى الأمام في تحديث وتوسيع نظام التذاكر غير التلامسية في جميع أنحاء الولاية، مع خطط للنشر الكامل عبر نظام السكك الحديدية للركاب بالكامل، تليها الحافلات والعبارات.
إيرادات وتوقعات سوق التذاكر الذكية في أمريكا الشمالية حتى عام 2031 (مليون دولار أمريكي)
تجزئة سوق التذاكر الذكية في أمريكا الشمالية
يتم تصنيف سوق التذاكر الذكية في أمريكا الشمالية إلى مكون ونظام دفع ومستخدم نهائي ودولة.
بناءً على المكون، يتم تقسيم سوق التذاكر الذكية في أمريكا الشمالية إلى أجهزة وبرامج وخدمات. احتل قطاع الأجهزة أكبر حصة سوقية في عام 2023.
من حيث التكنولوجيا، يتم تقسيم سوق التذاكر الذكية في أمريكا الشمالية إلى نظام دفع مفتوح وبطاقة ذكية وNFC. احتل قطاع البطاقات الذكية أكبر حصة سوقية في عام 2023.
بناءً على المستخدم النهائي، يتم تقسيم سوق التذاكر الذكية في أمريكا الشمالية إلى النقل والرياضة والترفيه ومواقف السيارات وغيرها. احتل قطاع النقل أكبر حصة سوقية في عام 2023.
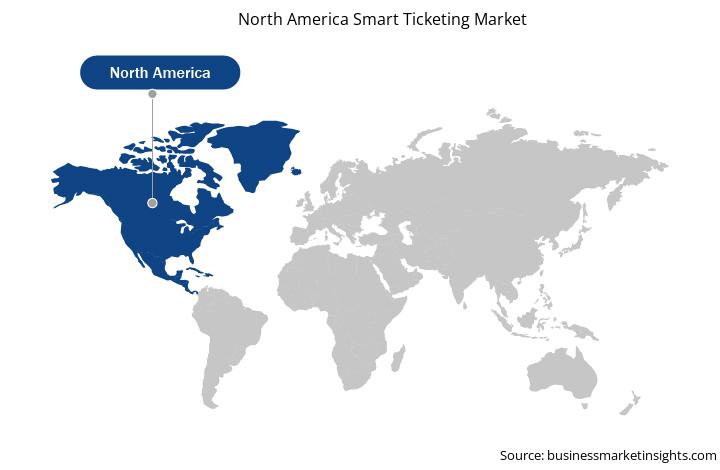
حسب البلد، يتم تقسيم سوق التذاكر الذكية في أمريكا الشمالية إلى الولايات المتحدة وكندا والمكسيك. سيطرت الولايات المتحدة على حصة سوق التذاكر الذكية في أمريكا الشمالية في عام 2023.
تعد Infineon Technologies AG و NXP Semiconductors NV و Xerox Holdings Corp و Cubic Corp و IDEMIA France SAS و Thales SA و Confidex و HID Global Corp و Siemens Energy AG من بين الشركات الرائدة العاملة في سوق التذاكر الذكية في أمريكا الشمالية.
North America Smart Ticketing Strategic Insights
Strategic insights for North America Smart Ticketing involve closely monitoring industry trends, consumer behaviours, and competitor actions to identify opportunities for growth. By leveraging data analytics, businesses can anticipate market shifts and make informed decisions that align with evolving customer needs. Understanding these dynamics helps companies adjust their strategies proactively, enhance customer engagement, and strengthen their competitive edge. Building strong relationships with stakeholders and staying agile in response to changes ensures long-term success in any market.
The regional scope of North America Smart Ticketing refers to the geographical area in which a business operates and competes. Understanding regional nuances, such as local consumer preferences, economic conditions, and regulatory environments, is crucial for tailoring strategies to specific markets. Businesses can expand their reach by identifying underserved regions or adapting their offerings to meet regional demands. A clear regional focus allows for more effective resource allocation, targeted marketing, and better positioning against local competitors, ultimately driving growth in those specific areas.
Get more information on this report
Identical Market Reports with other Region/Countries
The List of Companies - North America Smart Ticketing Market
Infineon Technologies AG.
NXP Semiconductors NV.
Xerox Holdings Corp.
Cubic Corp.
IDEMIA France SAS.
Thales SA.
Confidex.
HID Global Corp.
Siemens Energy AG.
Frequently Asked Questions
How big is the North America Smart Ticketing Market?
The North America Smart Ticketing Market is valued at US$ 2,248.30 Million in 2023, it is projected to reach US$ 5,558.26 Million by 2031.
What is the CAGR for North America Smart Ticketing Market by (2023 - 2031)?
As per our report North America Smart Ticketing Market, the market size is valued at US$ 2,248.30 Million in 2023, projecting it to reach US$ 5,558.26 Million by 2031. This translates to a CAGR of approximately 12.0% during the forecast period.
What segments are covered in this report?
The North America Smart Ticketing Market report typically cover these key segments-
المكون (الأجهزة والبرامج والخدمات)
نظام الدفع (نظام الدفع المفتوح، البطاقة الذكية، NFC)
المستخدم النهائي (النقل والرياضة والترفيه ومواقف السيارات)
What is the historic period, base year, and forecast period taken for North America Smart Ticketing Market?
The historic period, base year, and forecast period can vary slightly depending on the specific market research report. However, for the North America Smart Ticketing Market report:
Historic Period : 2021-2022
Base Year : 2023
Forecast Period : 2024-2031
Who are the major players in North America Smart Ticketing Market?
The North America Smart Ticketing Market is populated by several key players, each contributing to its growth and innovation. Some of the major players include:
Infineon Technologies AG.
NXP Semiconductors NV.
Xerox Holdings Corp.
Cubic Corp.
IDEMIA France SAS.
Thales SA.
Confidex.
HID Global Corp.
Siemens Energy AG.
Who should buy this report?
The North America Smart Ticketing Market report is valuable for diverse stakeholders, including:
Investors: Provides insights for investment decisions pertaining to market growth, companies, or industry insights. Helps assess market attractiveness and potential returns.
Industry Players: Offers competitive intelligence, market sizing, and trend analysis to inform strategic planning, product development, and sales strategies.
Suppliers and Manufacturers: Helps understand market demand for components, materials, and services related to concerned industry.
Researchers and Consultants: Provides data and analysis for academic research, consulting projects, and market studies.
Financial Institutions: Helps assess risks and opportunities associated with financing or investing in the concerned market.
Essentially, anyone involved in or considering involvement in the North America Smart Ticketing Market value chain can benefit from the information contained in a comprehensive market report.
Get Free Sample For North America Smart Ticketing Market
1. Complete the form
2. Check your inbox (and spam/junk folder)
3. Your Personal Data is Secure with us
GDPR + CCPA Compliant
Personal & transactional information is kept safe from unauthorized use.
WHAT'S INCLUDED IN FULL REPORT : Market Dynamics,
Competitive Analysis and Assessment, Define Business Strategies, Market Outlook and
Trends, Market Size and Share Analysis, Growth Driving Factors, Future Commercial
Potential, Identify Regional Growth Engines


 Get Free Sample For North America Smart Ticketing Market

