Analysis – by Type (Static Balancing Valves, Fixed-Orifice Balancing Valves, Automatic Balancing Valves, and Pressure-Independent Flow Control Valves), Connection Type (Flanged, Threaded, and Others), Size (Less then 5 Inches, 6-10 Inches, 11- 20 Inches, and Above 20 Inches), and Application (Residential, Commercial, and Industrial)
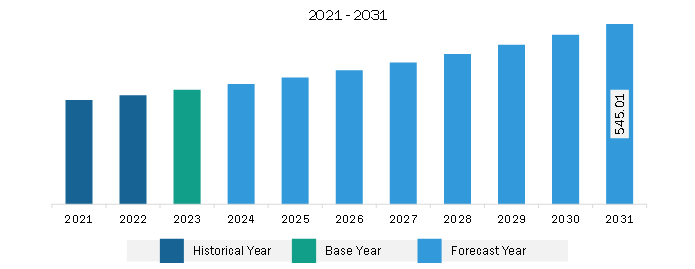
The North America hydronic balancing valves market was valued at US$ 345.75 million in 2023 and is expected to reach US$ 545.01 million by 2031; it is estimated to register a CAGR of 5.9% from 2023 to2031.
Increasing Demand for Energy-efficient Solutions Fuels North America Hydronic Balancing Valves Market
Consumer preference for energy-efficient appliances has been growing in recent times. Energy efficiency can provide long-term benefits by reducing overall electricity demand by lowering the need to invest in new infrastructure for electricity generation and transmission. It also contributes to the diversification of utility resource portfolios and can act as a buffer against the risk of volatile energy procurement expenditure. To attain energy efficiency, many manufacturing industries and commercial manufacturing companies are procuring high-efficiency HVAC systems. An efficient HVAC system utilizes less energy and operates more effectively than conventional systems, lowering the carbon footprint. In hydronic systems, the balancing valves facilitate the distribution of chilled or heated water to all terminals. The growing application of HVAC (Heating, Ventilation, and Air Conditioning) systems in air conditioning and heat pumps for achieving energy and growing implementation of energy efficiency standards for public buildings are boosting the demand for HVAC systems in various industrial and commercial sectors. Furthermore, growing initiatives of state and local governments are promoting energy efficiency programs and policies for public facilities, equipment usage, and government operations, which is boosting the application of HVAC systems. For instance, the renewable portfolio standard for New York was developed and implemented in 2004 and was expanded by Governor Cuomo's Clean Energy Standard (CES) in 2016. The CES has set a target of ~40% and approximately 80% reduction in greenhouse gas emissions by 2030 and 2050, respectively. One of the US states such as North Carolina has implemented renewable energy standards (RES) and the Zero-Emissions Credit (ZEC) requirement to lower carbon emissions. The main energy consumers in municipal-level operations are often the water and wastewater treatment facilities.
High-quality HVAC systems can be used at water and wastewater facilities to decrease energy costs and greenhouse gas emissions, which also increases the application of hydronic balancing valves. Thus, the growing demand for energy-efficient solutions drives the North America hydronic balancing valves market.
North America Hydronic Balancing Valves Market Overview
There is a rise in the adoption of HVAC systems owing to various features provided in these systems, such as energy efficiency and sustainability. According to Air Conditioning Contractors of America ACCA, HVAC services in North America are set to increase in value from US$ 25.6 billion in 2019 to US$ 35.8 billion by 2030. The growing application of HVAC systems is anticipated to propel the growth of the hydronic balancing valves market during the forecast period.
The hydronic balancing valves market is observing potential growth, owing to the rising adoption of advanced technologies and the increasing need for green construction solutions. Major application sectors such as residential, commercial, and industrial opt to integrate their HVAC systems into building management automation systems that streamline the system’s operation and maintenance. High technological development is boosting the application of advanced HVAC systems, which results in an increased usage of hydronic balancing valves in North America.
There is an increase in the utilization of advanced HVAC systems in various industries focused on energy efficiency and air quality improvement. The demand for hydronic balancing valves is directly influenced by the growth in manufacturing facilities, the pharmaceutical industry, IT, and ITES companies with rapid industrialization, along with the expansion of the service sector. Moreover, the wide presence of hydronic balancing valve manufacturers and suppliers such as Hays Fluid Controls, Victaulic Company, Red-White Valve Corp., Nibco Inc., Xylem Inc., and American Wheatley also fuels the market growth.
North America Hydronic Balancing Valves Market Revenue and Forecast to 2031 (US$ Million)
North America Hydronic Balancing Valves Market Segmentation
The North America hydronic balancing valves market is categorized into type, connection type, size, application, and country.
Based on type, the North America hydronic balancing valves market is segmented into static balancing valves, fixed-orifice balancing valves, automatic balancing valves, and pressure-independent flow control valves. The static balancing valves segment held the largest market share in 2023.
In terms of connection type, the North America hydronic balancing valves market is segmented into flanged, threaded, and others. The flanged segment held the largest market share in 2023.
By size, the North America hydronic balancing valves market is segmented into less then 5 inches, 6-10 inches, 11- 20 inches, and above 20 inches. The less then 5 inches segment held the largest market share in 2023.
By application, the North America hydronic balancing valves market is segmented into residential, commercial, and industrial. The residential segment held the largest market share in 2023.
By country, the North America hydronic balancing valves market is segmented into the US, Canada, and Mexico. The US dominated the North America hydronic balancing valves market share in 2023.
Caleffi S.p.a.; Danfoss AS; Frese A/S; Global Flow Products LLC; HAYS FLUID CONTROLS; Johnson Controls International Plc; Oventrop GmbH & Co. KG; Red-White Valve Corp.; Victaulic Company; and Xylem Inc. are some of the leading companies operating in the North America hydronic balancing valves market.
North America Hydronic Balancing Valves Market Strategic Insights
Get more information on this report
North America Hydronic Balancing Valves Market Segmentation Analysis
North America Hydronic Balancing Valves Market Report Highlights
North America Hydronic Balancing Valves Report Scope
Report Attribute
Details
Market size in 2023
US$ 345.75 Million
Market Size by 2031
US$ 545.01 Million
CAGR (2023 - 2031)
5.9%
Historical Data
2021-2022
Forecast period
2024-2031
Segments Covered
By Type
Static Balancing Valves
Fixed-Orifice Balancing Valves
Automatic Balancing Valves
Pressure-Independent Flow Control Valves
By Connection Type
Flanged
Threaded
By Size
Less then 5 Inches
6-10 Inches
11- 20 Inches
Above 20 Inches
By Application
Residential
Commercial
Industrial
Regions and Countries Covered
North America
US, Canada, Mexico
Market leaders and key company profiles
Caleffi S.p.a.
Danfoss AS
Global Flow Products LLC
HAYS FLUID CONTROLS
Johnson Controls International Plc
Oventrop GmbH & Co. KG
Red-White Valve Corp.
Victaulic Company
Xylem Inc.
Get more information on this report
North America Hydronic Balancing Valves Market Country and Regional Insights
Get more information on this report
Identical Market Reports with other Region/Countries
The List of Companies - North America Hydronic Balancing Valves Market
Caleffi S.p.a.Danfoss AS Global Flow Products LLCHAYS FLUID CONTROLSJohnson Controls International Plc Oventrop GmbH & Co. KGRed-White Valve Corp.Victaulic CompanyXylem Inc.
Frequently Asked Questions
How big is the North America Hydronic Balancing Valves Market?
The North America Hydronic Balancing Valves Market is valued at US$ 345.75 Million in 2023, it is projected to reach US$ 545.01 Million by 2031.
What is the CAGR for North America Hydronic Balancing Valves Market by (2023 - 2031)?
As per our report North America Hydronic Balancing Valves Market, the market size is valued at US$ 345.75 Million in 2023, projecting it to reach US$ 545.01 Million by 2031. This translates to a CAGR of approximately 5.9% during the forecast period.
What segments are covered in this report?
The North America Hydronic Balancing Valves Market report typically cover these key segments-
Type (Static Balancing Valves, Fixed-Orifice Balancing Valves, Automatic Balancing Valves, Pressure-Independent Flow Control Valves)
What is the historic period, base year, and forecast period taken for North America Hydronic Balancing Valves Market?
The historic period, base year, and forecast period can vary slightly depending on the specific market research report. However, for the North America Hydronic Balancing Valves Market report:
Historic Period : 2021-2022
Base Year : 2023
Forecast Period : 2024-2031
Who are the major players in North America Hydronic Balancing Valves Market?
The North America Hydronic Balancing Valves Market is populated by several key players, each contributing to its growth and innovation. Some of the major players include:
Caleffi S.p.a.
Danfoss AS
Global Flow Products LLC
HAYS FLUID CONTROLS
Johnson Controls International Plc
Oventrop GmbH & Co. KG
Red-White Valve Corp.
Victaulic Company
Xylem Inc.
Who should buy this report?
The North America Hydronic Balancing Valves Market report is valuable for diverse stakeholders, including:
Investors: Provides insights for investment decisions pertaining to market growth, companies, or industry insights. Helps assess market attractiveness and potential returns.
Industry Players: Offers competitive intelligence, market sizing, and trend analysis to inform strategic planning, product development, and sales strategies.
Suppliers and Manufacturers: Helps understand market demand for components, materials, and services related to concerned industry.
Researchers and Consultants: Provides data and analysis for academic research, consulting projects, and market studies.
Financial Institutions: Helps assess risks and opportunities associated with financing or investing in the concerned market.
Essentially, anyone involved in or considering involvement in the North America Hydronic Balancing Valves Market value chain can benefit from the information contained in a comprehensive market report.


 Get Free Sample For North America Hydronic Balancing Valves Market


