تحليلات الإنفاق في الشرق الأوسط وأفريقيا لتوقعات سوق الإلكترونيات وأشباه الموصلات حتى عام 2030 - التحليل الإقليمي - حسب المكون (البرمجيات والخدمة)، والنوع (التحليلات الوصفية، والتحليلات التنبؤية، والتحليلات الإرشادية)، والنشر (داخل الشركة والسحابة)، والتطبيق (الإدارة المالية، إدارة المخاطر، الحوكمة وإدارة الامتثال، تحديد مصادر الموردين وإدارة الأداء، التنبؤ بالطلب والعرض، وغيرها)
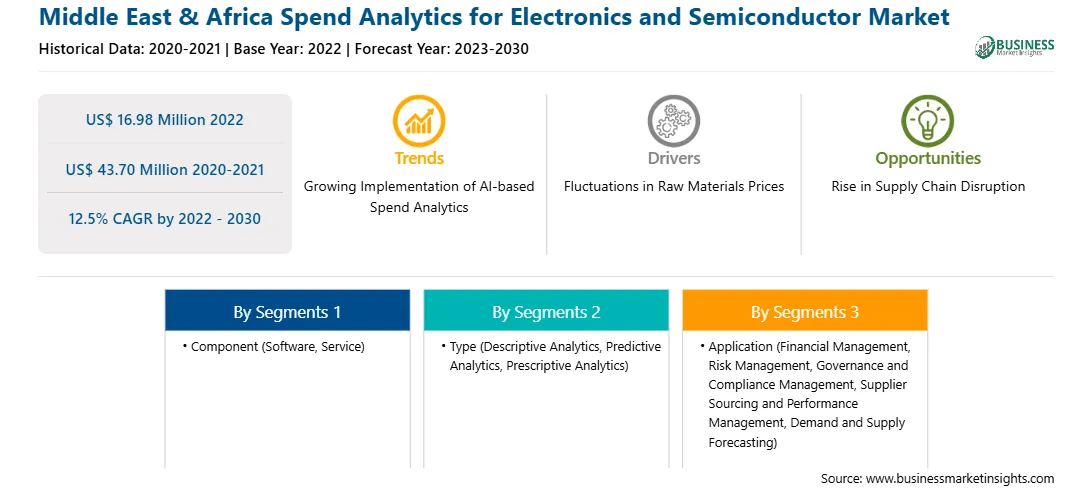
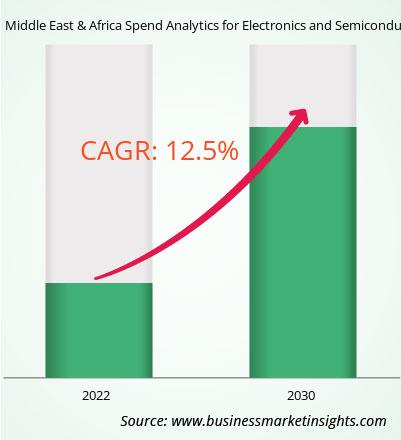
بلغت قيمة تحليلات الإنفاق في الشرق الأوسط وأفريقيا على سوق الإلكترونيات وأشباه الموصلات 16.98 مليون دولار أمريكي في عام 2022، ومن المتوقع أن تصل إلى 43.70 مليون دولار أمريكي بحلول عام 2030؛ ومن المقدر أن يسجل معدل نمو سنوي مركب قدره 12.5% من عام 2022 إلى عام 2030.
يعزز التنفيذ المتزايد لتحليلات الإنفاق القائمة على الذكاء الاصطناعي تحليلات الإنفاق في الشرق الأوسط وأفريقيا لسوق الإلكترونيات وأشباه الموصلات.
من المتوقع أن يؤدي تكامل الذكاء الاصطناعي (AI)، والذكاء الاصطناعي التوليدي، وتحليلات البيانات الضخمة، وإنترنت الأشياء (IoT)، والحوسبة السحابية، وأتمتة العمليات الآلية (RPA)، والتعرف على الصور، وغيرها من التقنيات إلى تعزيز قدرات تحليلات الإنفاق في السنوات القادمة. تساعد هذه التقنيات على أتمتة عمليات جمع البيانات وتحليلها، وتوفير رؤى تنبؤية، وتحسين استراتيجيات الشراء، وتحسين عملية صنع القرار بناءً على البيانات في الوقت الفعلي. في أكتوبر 2023، قدمت SAP SE تطورات جديدة في الذكاء الاصطناعي (AI) وتجربة المستخدم ضمن إدارة الإنفاق الشاملة وحلول شبكات الأعمال في حدث SAP Spend Connect Live، المعروف على نطاق واسع بالمؤتمر الرائد في مجال إدارة الإنفاق. وتهدف هذه الابتكارات إلى مساعدة العملاء في السيطرة على التكاليف، وتقليل المخاطر، وتعزيز الإنتاجية. إن التطورات التكنولوجية المرتبطة بتحليلات الإنفاق مدفوعة بتكامل الذكاء الاصطناعي (AI). يمكّن الذكاء الاصطناعي الآلات والتطبيقات البرمجية من التفكير والتعلم والتصرف مثل الإدراك البشري. تسمح هذه الإمكانية لأنظمة الذكاء الاصطناعي بتحليل مجموعات البيانات المعقدة والتعرف على الأنماط واتخاذ قرارات مستنيرة بناءً على المعلومات المتاحة. كما أدى ظهور تكنولوجيا الذكاء الاصطناعي إلى زيادة الطلب على رقائق أشباه الموصلات القوية والفعالة. تتطلب أنظمة الذكاء الاصطناعي قدرات حوسبة عالية الأداء لمعالجة وتحليل كميات كبيرة من البيانات في الوقت الفعلي. وقد أدى هذا الطلب إلى تطوير شرائح الذكاء الاصطناعي المتخصصة المُحسّنة لأعباء عمل الذكاء الاصطناعي. وبالتالي، من المتوقع أن يؤدي التنفيذ المتزايد لتحليلات الإنفاق القائمة على الذكاء الاصطناعي إلى خلق فرص كبيرة لتحليلات الإنفاق لنمو سوق الإلكترونيات وأشباه الموصلات في السنوات القادمة.
تحليلات الإنفاق في الشرق الأوسط وإفريقيا نظرة عامة على سوق الإلكترونيات وأشباه الموصلات
يعد الاعتماد المتزايد للأجهزة القائمة على التكنولوجيا المتقدمة، وانتشار قطاع السيارات، والطلب المتزايد على الإلكترونيات الاستهلاكية، من العوامل المؤثرة على الاقتصاد العالمي. عدد قليل من العوامل الجديرة بالملاحظة التي تفضل تحليلات الإنفاق لسوق الإلكترونيات وأشباه الموصلات في الشرق الأوسط وإفريقيا. ويساهم قطاع السيارات في المنطقة بشكل كبير في نمو السوق، حيث تعتبر أشباه الموصلات مكونات حاسمة في المركبات. علاوة على ذلك، يميل الأفراد والشركات في الشرق الأوسط وإفريقيا بشكل كبير نحو الأجهزة والتقنيات الإلكترونية المتقدمة. ويعد الطلب المتزايد على الأجهزة الإلكترونية الاستهلاكية أيضًا عاملاً مهمًا يدفع إلى اعتماد حلول تحليلات الإنفاق في قطاع الإلكترونيات وأشباه الموصلات في المنطقة. تواجه الشركات في صناعة الإلكترونيات الاستهلاكية المزدهرة التحدي المتمثل في إدارة نفقاتها بكفاءة للحفاظ على القدرة التنافسية وتلبية تفضيلات عملائها المتغيرة. يصبح اعتماد حلول تحليلات الإنفاق أمرًا بالغ الأهمية لأنها توفر رؤى قيمة حول أنماط الإنفاق، وتحدد فرص تحسين التكلفة، وتسهل اتخاذ القرارات المستنيرة، وبالتالي ضمان بقاء الشركات قادرة على التكيف والاستجابة في السوق سريع الخطى.
تحليلات الإنفاق في الشرق الأوسط وأفريقيا لإيرادات سوق الإلكترونيات وأشباه الموصلات والتوقعات حتى عام 2030 (مليون دولار أمريكي)
تحليلات الإنفاق في الشرق الأوسط وأفريقيا لتجزئة سوق الإلكترونيات وأشباه الموصلات
>يتم تقسيم تحليلات الإنفاق في الشرق الأوسط وأفريقيا لسوق الإلكترونيات وأشباه الموصلات بناءً على المكون والنوع والنشر والتطبيق والبلد. استنادًا إلى المكونات، تنقسم تحليلات الإنفاق في منطقة الشرق الأوسط وأفريقيا لسوق الإلكترونيات وأشباه الموصلات إلى برمجيات وخدمات. استحوذت خدمات البرمجيات على حصة سوقية أكبر في عام 2022.
استنادًا إلى النوع، يتم تقسيم تحليلات الإنفاق في الشرق الأوسط وأفريقيا لسوق الإلكترونيات وأشباه الموصلات إلى تحليلات وصفية، وتحليلات تنبؤية، وتحليلات توجيهية. استحوذت التحليلات التنبؤية على أكبر حصة سوقية في عام 2022.
فيما يتعلق بالنشر، تنقسم تحليلات الإنفاق في الشرق الأوسط وأفريقيا لسوق الإلكترونيات وأشباه الموصلات إلى محلية وسحابية. استحوذت السحابة على حصة سوقية أكبر في عام 2022.
من خلال التطبيق، يتم تقسيم تحليلات الإنفاق في الشرق الأوسط وأفريقيا لسوق الإلكترونيات وأشباه الموصلات إلى الإدارة المالية، وإدارة المخاطر، والحوكمة وإدارة الامتثال، ومصادر الموردين، وإدارة الأداء. والتنبؤ بالطلب والعرض وغيرها. استحوذت مصادر الموردين وإدارة الأداء على أكبر حصة سوقية في عام 2022.
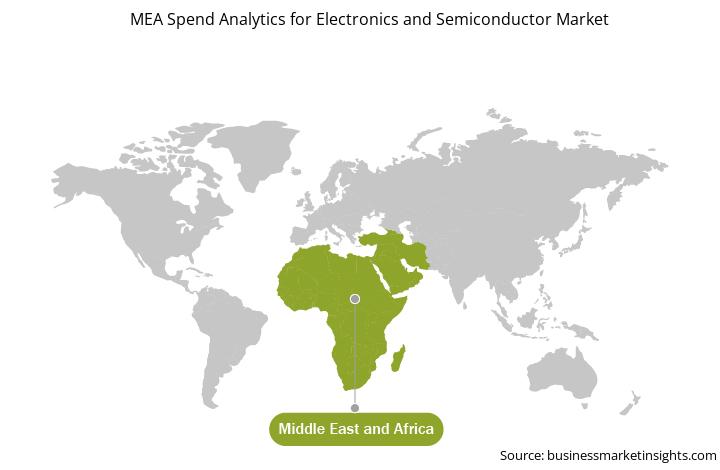
استنادًا إلى البلد، تم تقسيم تحليلات الإنفاق في الشرق الأوسط وأفريقيا لسوق الإلكترونيات وأشباه الموصلات إلى جنوب إفريقيا والمملكة العربية السعودية والإمارات العربية المتحدة ودولة الإمارات العربية المتحدة. بقية دول الشرق الأوسط وأفريقيا. هيمنت بقية دول الشرق الأوسط وأفريقيا على تحليلات الإنفاق على حصة سوق الإلكترونيات وأشباه الموصلات في الشرق الأوسط وأفريقيا في عام 2022.
Coupa Software Inc، وInternational Business Machines Corp، وIvalua Inc، وNB Ventures Inc، وSAP SE، و تعد شركة Zycus Inc من الشركات الرائدة العاملة في الشرق الأوسط وإفريقيا التي تقوم بتحليلات الإنفاق في سوق الإلكترونيات وأشباه الموصلات.
Middle East & Africa Spend Analytics for Electronics and Semiconductor Strategic Insights
Strategic insights for Middle East & Africa Spend Analytics for Electronics and Semiconductor involve closely monitoring industry trends, consumer behaviours, and competitor actions to identify opportunities for growth. By leveraging data analytics, businesses can anticipate market shifts and make informed decisions that align with evolving customer needs. Understanding these dynamics helps companies adjust their strategies proactively, enhance customer engagement, and strengthen their competitive edge. Building strong relationships with stakeholders and staying agile in response to changes ensures long-term success in any market.
Get more information on this report
Middle East & Africa Spend Analytics for Electronics and Semiconductor Report Scope
جنوب أفريقيا، المملكة العربية السعودية، الإمارات العربية المتحدة، بقية الشرق الأوسط وأفريقيا
Market leaders and key company profiles
Coupa Software Inc
International Business Machines Corp
Ivalua Inc
NB Ventures Inc
SAP SE
Zycus Inc
Get more information on this report
Middle East & Africa Spend Analytics for Electronics and Semiconductor Regional Insights
The regional scope of Middle East & Africa Spend Analytics for Electronics and Semiconductor refers to the geographical area in which a business operates and competes. Understanding regional nuances, such as local consumer preferences, economic conditions, and regulatory environments, is crucial for tailoring strategies to specific markets. Businesses can expand their reach by identifying underserved regions or adapting their offerings to meet regional demands. A clear regional focus allows for more effective resource allocation, targeted marketing, and better positioning against local competitors, ultimately driving growth in those specific areas.
Get more information on this report
Identical Market Reports with other Region/Countries
The List of Companies - Middle East & Africa Spend Analytics for Electronics and Semiconductor Market
1. Coupa Software Inc 2. International Business Machines Corp 3. Ivalua Inc 4. NB Ventures Inc 5. SAP SE 6. Zycus Inc
Frequently Asked Questions
How big is the Middle East & Africa Spend Analytics for Electronics and Semiconductor Market?
The Middle East & Africa Spend Analytics for Electronics and Semiconductor Market is valued at US$ 16.98 Million in 2022, it is projected to reach US$ 43.70 Million by 2030.
What is the CAGR for Middle East & Africa Spend Analytics for Electronics and Semiconductor Market by (2022 - 2030)?
As per our report Middle East & Africa Spend Analytics for Electronics and Semiconductor Market, the market size is valued at US$ 16.98 Million in 2022, projecting it to reach US$ 43.70 Million by 2030. This translates to a CAGR of approximately 12.5% during the forecast period.
What segments are covered in this report?
The Middle East & Africa Spend Analytics for Electronics and Semiconductor Market report typically cover these key segments-
المكون (البرمجيات، الخدمات)
النوع (التحليل الوصفي، التحليل التنبئي، التحليل الوصفي)
التطبيقات (الإدارة المالية، إدارة المخاطر، إدارة الحوكمة والامتثال، مصادر الموردين وإدارة الأداء، التنبؤ بالطلب والعرض)
What is the historic period, base year, and forecast period taken for Middle East & Africa Spend Analytics for Electronics and Semiconductor Market?
The historic period, base year, and forecast period can vary slightly depending on the specific market research report. However, for the Middle East & Africa Spend Analytics for Electronics and Semiconductor Market report:
Historic Period : 2020-2021
Base Year : 2022
Forecast Period : 2023-2030
Who are the major players in Middle East & Africa Spend Analytics for Electronics and Semiconductor Market?
The Middle East & Africa Spend Analytics for Electronics and Semiconductor Market is populated by several key players, each contributing to its growth and innovation. Some of the major players include:
Coupa Software Inc
International Business Machines Corp
Ivalua Inc
NB Ventures Inc
SAP SE
Zycus Inc
Who should buy this report?
The Middle East & Africa Spend Analytics for Electronics and Semiconductor Market report is valuable for diverse stakeholders, including:
Investors: Provides insights for investment decisions pertaining to market growth, companies, or industry insights. Helps assess market attractiveness and potential returns.
Industry Players: Offers competitive intelligence, market sizing, and trend analysis to inform strategic planning, product development, and sales strategies.
Suppliers and Manufacturers: Helps understand market demand for components, materials, and services related to concerned industry.
Researchers and Consultants: Provides data and analysis for academic research, consulting projects, and market studies.
Financial Institutions: Helps assess risks and opportunities associated with financing or investing in the concerned market.
Essentially, anyone involved in or considering involvement in the Middle East & Africa Spend Analytics for Electronics and Semiconductor Market value chain can benefit from the information contained in a comprehensive market report.
Get Free Sample For Middle East & Africa Spend Analytics for Electronics and Semiconductor Market
1. Complete the form
2. Check your inbox (and spam/junk folder)
3. Your Personal Data is Secure with us
GDPR + CCPA Compliant
Personal & transactional information is kept safe from unauthorized use.
WHAT'S INCLUDED IN FULL REPORT : Market Dynamics,
Competitive Analysis and Assessment, Define Business Strategies, Market Outlook and
Trends, Market Size and Share Analysis, Growth Driving Factors, Future Commercial
Potential, Identify Regional Growth Engines


 Get Free Sample For Middle East & Africa Spend Analytics for Electronics and Semiconductor Market

