Analysis – by Type (Static Balancing Valves, Fixed-Orifice Balancing Valves, Automatic Balancing Valves, and Pressure-Independent Flow Control Valves), Connection Type (Flanged, Threaded, and Others), Size (Less then 5 Inches, 6-10 Inches, 11- 20 Inches, and Above 20 Inches), and Application (Residential, Commercial, and Industrial)
No. of Pages:86
Report Code:
BMIRE00031077
Category:
Manufacturing and Construction
Middle East & Africa Hydronic Balancing Valves Market
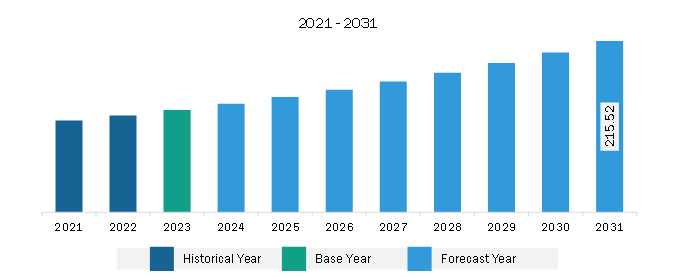
The Middle East & Africa hydronic balancing valves market was valued at US$ 128.88 million in 2023 and is expected to reach US$ 215.52 million by 2031; it is estimated to register a CAGR of 6.6% from 2023 to2031.
Utilization of Sustainable Materials and Components in Public Infrastructure Bolsters Middle East & Africa Hydronic Balancing Valves Market
The increasing concern for environmental pollution and carbon emissions from different industries has encouraged the governments of several nations to adopt more eco-friendly and sustainable alternatives with low to zero carbon emission rates. The industrial sector is a major carbon-centric sector with a substantial share in growing environmental pollution worldwide. The use of environment-friendly components such as hydronic balancing valves manufactured from recycled products can reduce the carbon footprint across the globe. Furthermore, the adoption of lead-free components for fabricating hydronic balancing valves for use in commercial and public infrastructure is rising and is anticipated to become more prominent in the coming years. Companies like ACS Valves, and Valmet are focusing on developing valves from recycled products. Thus, the increasing proliferation and usage of sustainable components as a viable alternative to conventional hydronic balancing valves in the commercial and public infrastructure sector is anticipated to fuel the market growth in the coming years.
Middle East & Africa Hydronic Balancing Valves Market Overview
The Middle East & Africa (MEA) is steadily witnessing significant potential for the Middle East & Africa hydronic balancing valves market growth. The regulations stated by governments of various countries in the Middle East are focused on energy efficiency and emphasize the usage of eco-friendly refrigerants, which are the least detrimental to the environment. This boosts the need for HVAC systems as these systems in countries such as South Africa, Saudi Arabia, and the UAE. The growing utilization of HVAC systems boosts the demand for hydronic balancing valves in the Middle East & Africa. Extreme weather conditions, growth in infrastructure and urban development projects, and increasing population are other factors boosting the utilization of HVAC systems, which is also propelling the Middle East & Africa hydronic balancing valves market across various countries in the Middle East & Africa. The rising focus on developing construction projects such as modern utilities and infrastructure facilities of smart cities and an increasing number of global events are encouraging global players to invest in the Middle East & Africa hydronic balancing valves market in the Middle East & Africa. For example, events such as the FIFA World Cup 2022, Dubai Expo 2020, and Dubai 2022 Winter Olympics have led large-scale companies and government agencies to build new-age shopping centers, hospitals, hotels, airports, and apartments, among others. Thus, the rise in infrastructure development fuels the Middle East & Africa hydronic balancing valves market growth.
Middle East & Africa Hydronic Balancing Valves Market Revenue and Forecast to 2031 (US$ Million)
Middle East & Africa Hydronic Balancing Valves Market Segmentation
The Middle East & Africa hydronic balancing valves market is categorized into type, connection type, size, application, and country.
Based on type, the Middle East & Africa hydronic balancing valves market is segmented into static balancing valves, fixed-orifice balancing valves, automatic balancing valves, and pressure-independent flow control valves. The static balancing valves segment held the largest market share in 2023.
In terms of connection type, the Middle East & Africa hydronic balancing valves market is segmented into flanged, threaded, and others. The flanged segment held the largest market share in 2023.
By size, the Middle East & Africa hydronic balancing valves market is segmented into less then 5 inches, 6-10 inches, 11- 20 inches, and above 20 inches. The less then 5 inches segment held the largest market share in 2023.
By application, the Middle East & Africa hydronic balancing valves market is segmented into residential, commercial, and industrial. The residential segment held the largest market share in 2023.
By country, the Middle East & Africa hydronic balancing valves market is segmented into South Africa, Saudi Arabia, the UAE, and the Rest of Middle East & Africa. Saudi Arabia dominated the Middle East & Africa hydronic balancing valves market share in 2023.
Danfoss AS, Johnson Controls International Plc, Xylem Inc., Victaulic Company, Oventrop GmbH & Co. KG, and Caleffi S.p.a. are some of the leading companies operating in the Middle East & Africa hydronic balancing valves market.
Middle East & Africa Hydronic Balancing Valves Market Strategic Insights
Get more information on this report
Middle East & Africa Hydronic Balancing Valves Market Segmentation Analysis
Middle East & Africa Hydronic Balancing Valves Market Report Highlights
Middle East & Africa Hydronic Balancing Valves Report Scope
Report Attribute
Details
Market size in 2023
US$ 128.88 Million
Market Size by 2031
US$ 215.52 Million
CAGR (2023 - 2031)
6.6%
Historical Data
2021-2022
Forecast period
2024-2031
Segments Covered
By Type
Static Balancing Valves
Fixed-Orifice Balancing Valves
Automatic Balancing Valves
Pressure-Independent Flow Control Valves
By Connection Type
Flanged
Threaded
By Size
Less then 5 Inches
6-10 Inches
11- 20 Inches
Above 20 Inches
By Application
Residential
Commercial
Industrial
Regions and Countries Covered
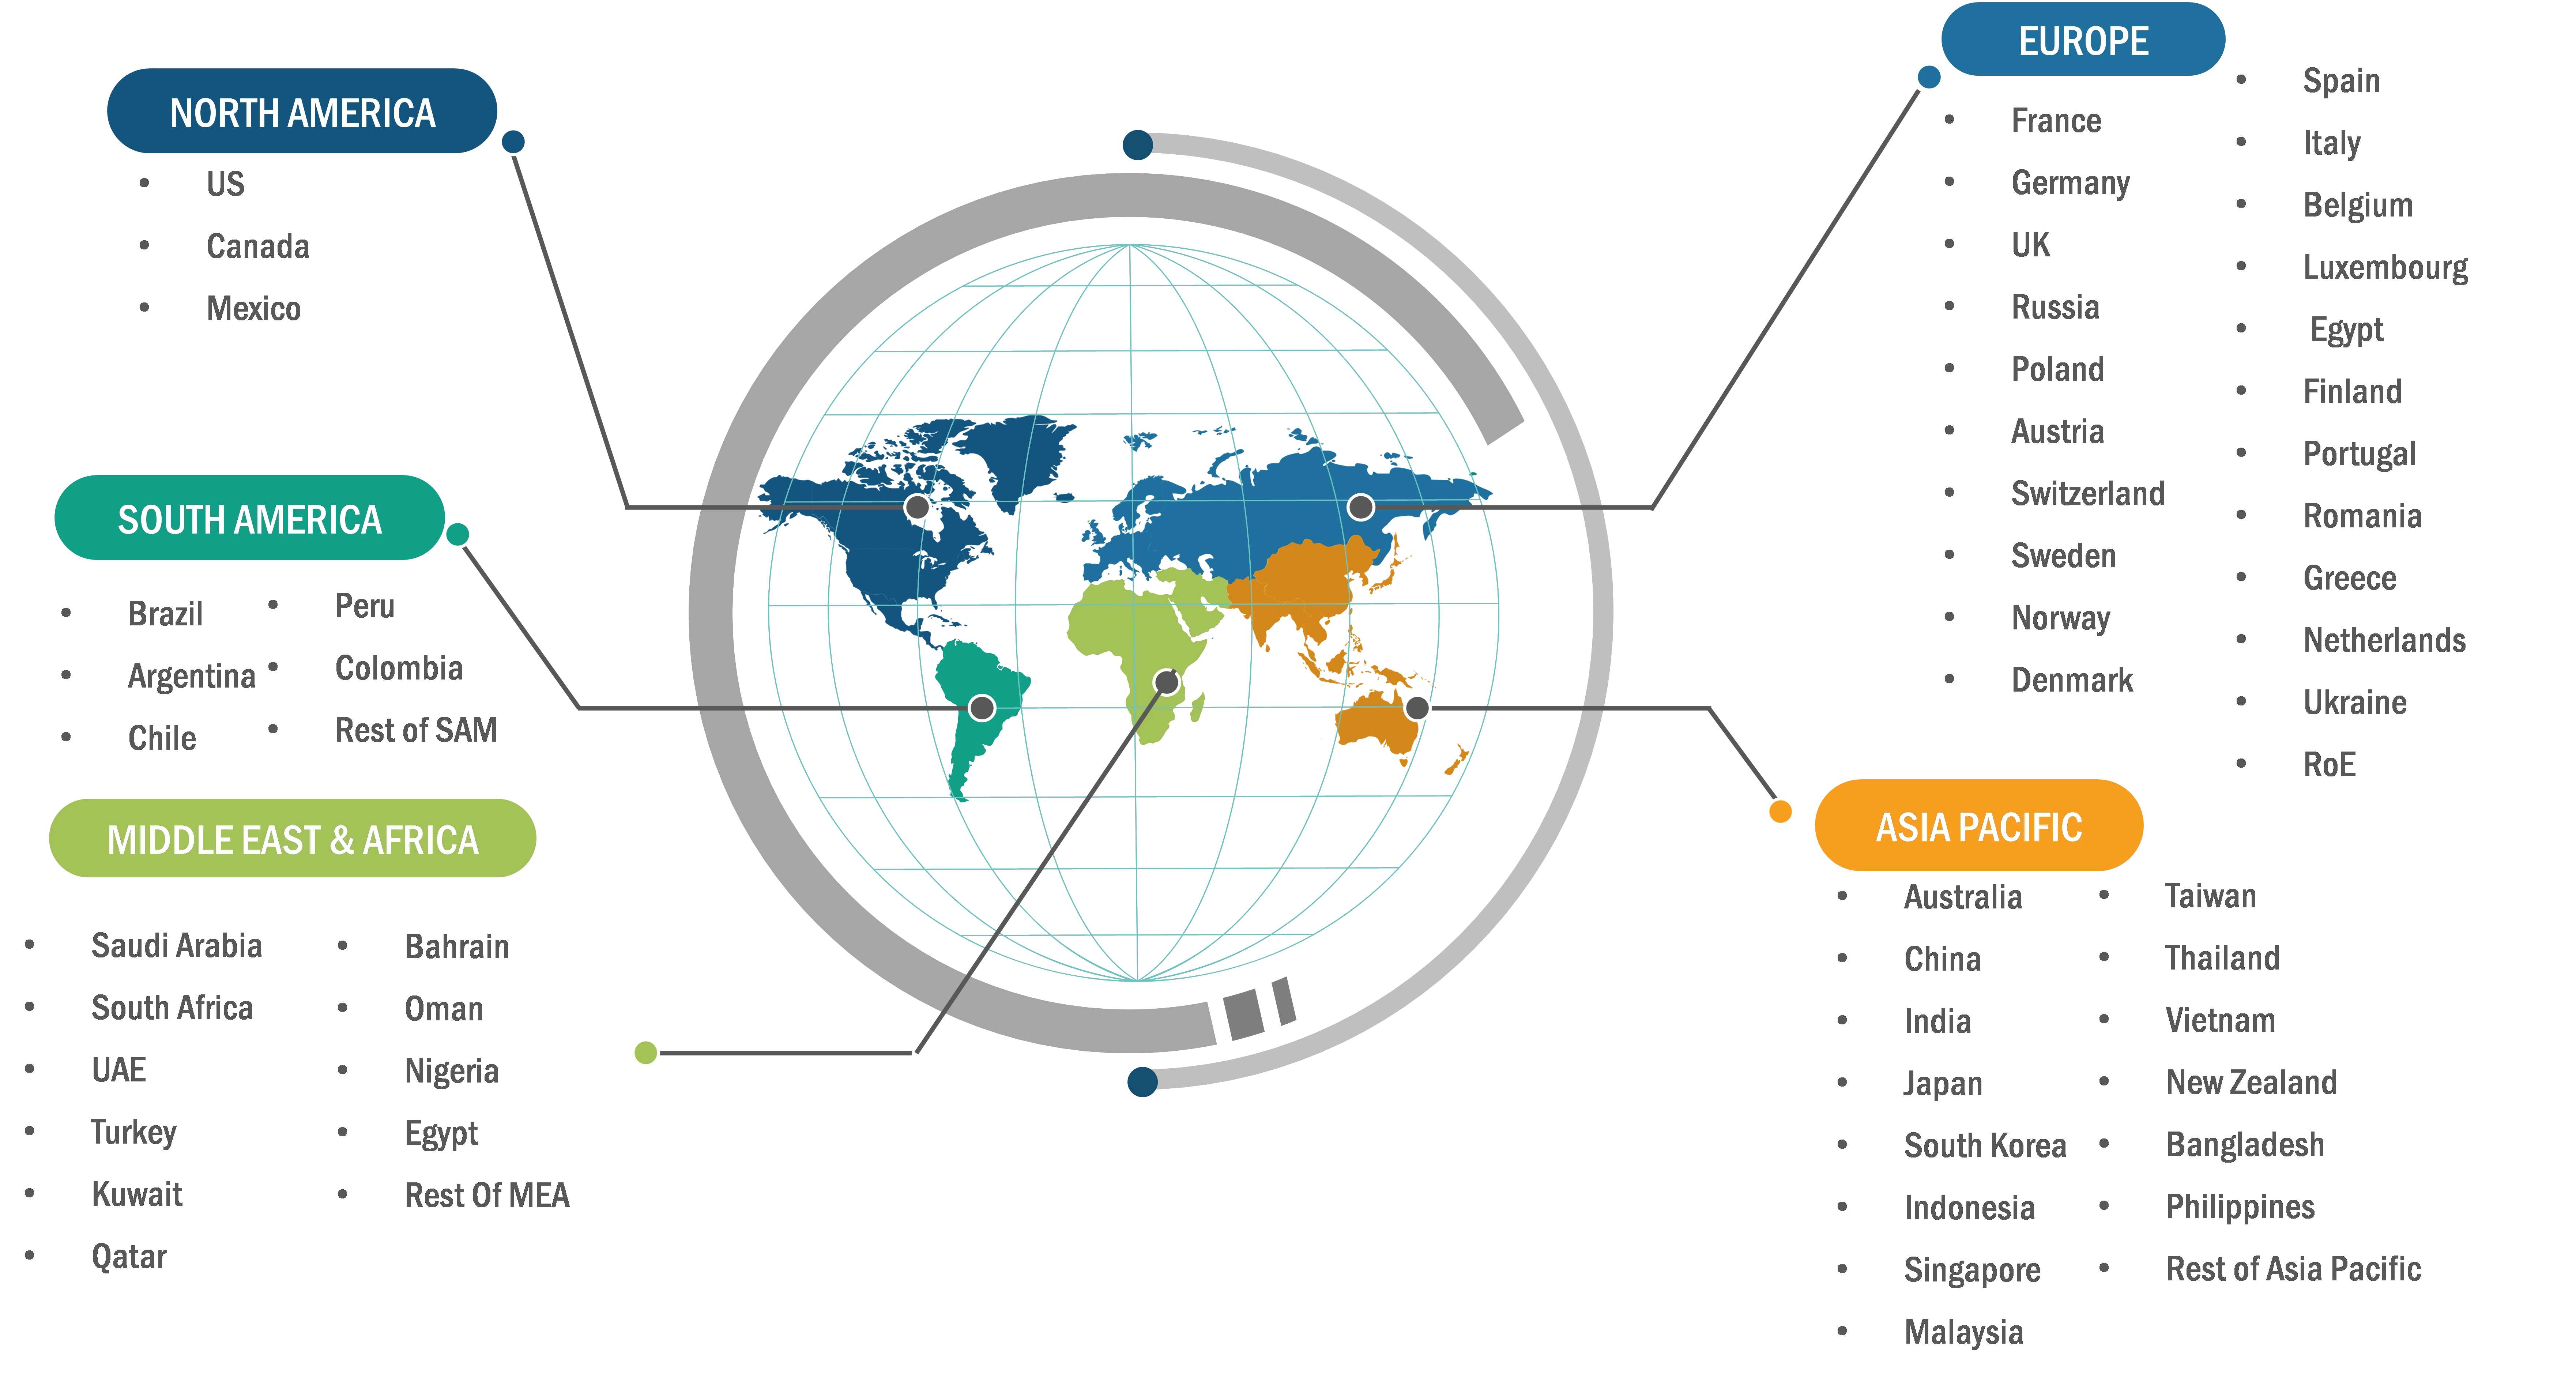
Middle East and Africa
South Africa, Saudi Arabia, UAE, Rest of Middle East and Africa
Market leaders and key company profiles
Danfoss AS
Johnson Controls International Plc
Xylem Inc.
Victaulic Company
Oventrop GmbH & Co. KG
Caleffi S.p.a.
Frese A/S
Get more information on this report
Middle East & Africa Hydronic Balancing Valves Market Country and Regional Insights
Get more information on this report
Identical Market Reports with other Region/Countries
The List of Companies - Middle East & Africa Hydronic Balancing Valves Market
Danfoss ASJohnson Controls International PlcXylem Inc.Victaulic Company Oventrop GmbH & Co. KG Caleffi S.p.a. Frese A/S
Frequently Asked Questions
How big is the Middle East & Africa Hydronic Balancing Valves Market?
The Middle East & Africa Hydronic Balancing Valves Market is valued at US$ 128.88 Million in 2023, it is projected to reach US$ 215.52 Million by 2031.
What is the CAGR for Middle East & Africa Hydronic Balancing Valves Market by (2023 - 2031)?
As per our report Middle East & Africa Hydronic Balancing Valves Market, the market size is valued at US$ 128.88 Million in 2023, projecting it to reach US$ 215.52 Million by 2031. This translates to a CAGR of approximately 6.6% during the forecast period.
What segments are covered in this report?
The Middle East & Africa Hydronic Balancing Valves Market report typically cover these key segments-
Type (Static Balancing Valves, Fixed-Orifice Balancing Valves, Automatic Balancing Valves, Pressure-Independent Flow Control Valves)
What is the historic period, base year, and forecast period taken for Middle East & Africa Hydronic Balancing Valves Market?
The historic period, base year, and forecast period can vary slightly depending on the specific market research report. However, for the Middle East & Africa Hydronic Balancing Valves Market report:
Historic Period : 2021-2022
Base Year : 2023
Forecast Period : 2024-2031
Who are the major players in Middle East & Africa Hydronic Balancing Valves Market?
The Middle East & Africa Hydronic Balancing Valves Market is populated by several key players, each contributing to its growth and innovation. Some of the major players include:
Danfoss AS
Johnson Controls International Plc
Xylem Inc.
Victaulic Company
Oventrop GmbH & Co. KG
Caleffi S.p.a.
Frese A/S
Who should buy this report?
The Middle East & Africa Hydronic Balancing Valves Market report is valuable for diverse stakeholders, including:
Investors: Provides insights for investment decisions pertaining to market growth, companies, or industry insights. Helps assess market attractiveness and potential returns.
Industry Players: Offers competitive intelligence, market sizing, and trend analysis to inform strategic planning, product development, and sales strategies.
Suppliers and Manufacturers: Helps understand market demand for components, materials, and services related to concerned industry.
Researchers and Consultants: Provides data and analysis for academic research, consulting projects, and market studies.
Financial Institutions: Helps assess risks and opportunities associated with financing or investing in the concerned market.
Essentially, anyone involved in or considering involvement in the Middle East & Africa Hydronic Balancing Valves Market value chain can benefit from the information contained in a comprehensive market report.


 Get Free Sample For Middle East & Africa Hydronic Balancing Valves Market


