analysis - by Component (Software and Service), Type (Descriptive Analytics, Predictive Analytics, and Prescriptive Analytics), Deployment (On-Premise and Cloud), and Application (Financial Management, Risk Management, Governance and Compliance Management, Supplier Sourcing and Performance Management, Demand and Supply Forecasting, and Others)
No. of Pages:96
Report Code:
BMIRE00030431
Category:
Technology, Media and Telecommunications
Europe Spend Analytics for Electronics and Semiconductor Market
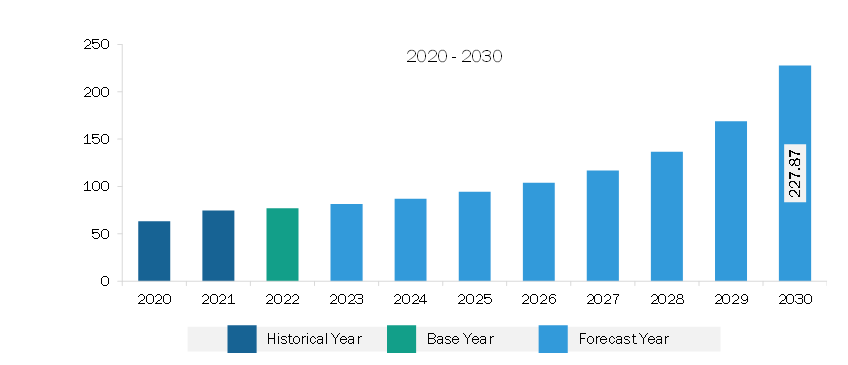
The Europe spend analytics for electronics and semiconductor market was valued at US$ 76.98 million in 2022 and is expected to reach US$ 227.87 million by 2030; it is estimated to register a CAGR of 14.5% from 2022 to 2030.
Rise in Demand for Consumer Electronics Drives Europe Spend Analytics for Electronics and Semiconductor Market.
The electronics and semiconductor market experienced a significant surge in demand for smartphones, tablets, wearable devices, and other consumer electronics. This increase in demand highlighted the necessity for spending analytics within the industry. As the consumer electronics market expanded, companies in this sector faced the challenge of efficiently managing their expenditures to maintain competitiveness and meet their customers' changing preferences. The adoption of spend analytics solutions became crucial as it provided valuable insights into spending patterns, identified opportunities for cost optimization, and facilitated informed decision-making to ensure companies remained adaptable and responsive in this fast-paced market. Also, spend analytics help companies streamline their procurement processes, identify potential areas for cost reduction, and strategically allocate resources to meet the growing demand for consumer electronics, which boosts the spend analytics for electronics and semiconductor market growth.
Europe Spend Analytics for Electronics and Semiconductor Market Overview
The conflict between Russia and Ukraine has had widespread implications, specifically causing disruptions in agriculture, energy, electronics and semiconductor, and manufacturing sectors. The ongoing Russia-Ukraine war can potentially worsen the existing semiconductor supply chain challenges and the persistent chip shortages, which have been troubling the industry for the past few years. Disruptions in the supply of crucial raw materials such as neon and palladium used in semiconductor manufacturing are among the recent concerns regarding the semiconductor supply chain. Although the short-term effects of inflation and indirect supply chain disruptions seem controllable, the long-term consequences are uncertain, as they would depend on events unfolding in the future. These disruptions have resulted in higher prices, supply uncertainties, and an urge to optimize procurement processes. In such circumstances, organizations must closely monitor and analyze their spending patterns to identify alternative suppliers, manage costs, and mitigate risks associated with supply chain disruptions. Thus, the adoption of spend analytics solutions becomes particularly important in dealing with the consequences of supply chain disruptions. Therefore, the ongoing Russia-Ukraine war and supply chain disruptions propel the demand for spend analytics solutions in the electronics and semiconductor sector in Europe.
Europe Spend Analytics for Electronics and Semiconductor Market Revenue and Forecast to 2030 (US$ Million)
Europe Spend Analytics for Electronics and Semiconductor Market Segmentation
The Europe spend analytics for electronics and semiconductor market is segmented based on component, type, deployment, application, and country. Based on component, the Europe spend analytics for electronics and semiconductor market is bifurcated into software and services. The software services held a larger market share in 2022.
Based on type, the Europe spend analytics for electronics and semiconductor market is segmented into descriptive analytics, predictive analytics, and prescriptive analytics. The predictive analytics held the largest market share in 2022.
In terms of deployment, the Europe spend analytics for electronics and semiconductor market is bifurcated into on-premise and cloud. The cloud held a larger market share in 2022
By application, the Europe spend analytics for electronics and semiconductor market is segmented into financial management, risk management, governance & compliance management, supplier sourcing & performance management, demand & supply forecasting, and others. The supplier sourcing & performance management held the largest market share in 2022.
Based on country, the Europe spend analytics for electronics and semiconductor market is segmented into Germany, France, Italy, the UK, Russia, and the Rest of Europe. Germany dominated the Europe spend analytics for electronics and semiconductor market share in 2022.
Coupa Software Inc, International Business Machines Corp, Ivalua Inc, NB Ventures Inc, SAP SE, Scanmarket AS, Synertrade Inc, Vortal Connecting Business SA, and Zycus Inc are some of the leading companies operating in the Europe spend analytics for electronics and semiconductor market.
Europe Spend Analytics for Electronics and Semiconductor Market Strategic Insights
Get more information on this report
Europe Spend Analytics for Electronics and Semiconductor Market Segmentation Analysis
Europe Spend Analytics for Electronics and Semiconductor Market Report Highlights
Europe Spend Analytics for Electronics and Semiconductor Report Scope
Report Attribute
Details
Market size in 2022
US$ 76.98 Million
Market Size by 2030
US$ 227.87 Million
CAGR (2022 - 2030)
14.5%
Historical Data
2020-2021
Forecast period
2023-2030
Segments Covered
By Component
Software
Service
By Type
Descriptive Analytics
Predictive Analytics
Prescriptive Analytics
By Application
Financial Management
Risk Management
Governance and Compliance Management
Supplier Sourcing and Performance Management
Demand and Supply Forecasting
Regions and Countries Covered
Europe
UK, Germany, France, Russia, Italy, Rest of Europe
Market leaders and key company profiles
Coupa Software Inc
International Business Machines Corp
Ivalua Inc
NB Ventures Inc
SAP SE
Scanmarket AS
Synertrade Inc
Vortal Connecting Business SA
Zycus Inc.
Get more information on this report
Europe Spend Analytics for Electronics and Semiconductor Market Country and Regional Insights
Get more information on this report
Identical Market Reports with other Region/Countries
The List of Companies - Europe Spend Analytics for Electronics and Semiconductor Market
1. Coupa Software Inc2. International Business Machines Corp3. Ivalua Inc4. NB Ventures Inc5. SAP SE6. Scanmarket AS7. Synertrade Inc8. Vortal Connecting Business SA 9. Zycus Inc.
Frequently Asked Questions
How big is the Europe Spend Analytics for Electronics and Semiconductor Market?
The Europe Spend Analytics for Electronics and Semiconductor Market is valued at US$ 76.98 Million in 2022, it is projected to reach US$ 227.87 Million by 2030.
What is the CAGR for Europe Spend Analytics for Electronics and Semiconductor Market by (2022 - 2030)?
As per our report Europe Spend Analytics for Electronics and Semiconductor Market, the market size is valued at US$ 76.98 Million in 2022, projecting it to reach US$ 227.87 Million by 2030. This translates to a CAGR of approximately 14.5% during the forecast period.
What segments are covered in this report?
The Europe Spend Analytics for Electronics and Semiconductor Market report typically cover these key segments-
Component (Software, Service)
Type (Descriptive Analytics, Predictive Analytics, Prescriptive Analytics)
Application (Financial Management, Risk Management, Governance and Compliance Management, Supplier Sourcing and Performance Management, Demand and Supply Forecasting)
What is the historic period, base year, and forecast period taken for Europe Spend Analytics for Electronics and Semiconductor Market?
The historic period, base year, and forecast period can vary slightly depending on the specific market research report. However, for the Europe Spend Analytics for Electronics and Semiconductor Market report:
Historic Period : 2020-2021
Base Year : 2022
Forecast Period : 2023-2030
Who are the major players in Europe Spend Analytics for Electronics and Semiconductor Market?
The Europe Spend Analytics for Electronics and Semiconductor Market is populated by several key players, each contributing to its growth and innovation. Some of the major players include:
Coupa Software Inc
International Business Machines Corp
Ivalua Inc
NB Ventures Inc
SAP SE
Scanmarket AS
Synertrade Inc
Vortal Connecting Business SA
Zycus Inc.
Who should buy this report?
The Europe Spend Analytics for Electronics and Semiconductor Market report is valuable for diverse stakeholders, including:
Investors: Provides insights for investment decisions pertaining to market growth, companies, or industry insights. Helps assess market attractiveness and potential returns.
Industry Players: Offers competitive intelligence, market sizing, and trend analysis to inform strategic planning, product development, and sales strategies.
Suppliers and Manufacturers: Helps understand market demand for components, materials, and services related to concerned industry.
Researchers and Consultants: Provides data and analysis for academic research, consulting projects, and market studies.
Financial Institutions: Helps assess risks and opportunities associated with financing or investing in the concerned market.
Essentially, anyone involved in or considering involvement in the Europe Spend Analytics for Electronics and Semiconductor Market value chain can benefit from the information contained in a comprehensive market report.


 Get Free Sample For Europe Spend Analytics for Electronics and Semiconductor Market


