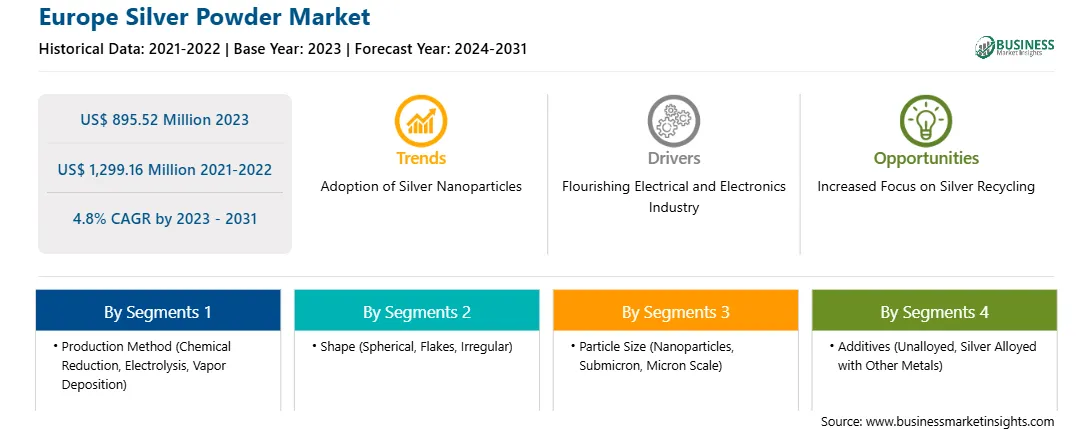
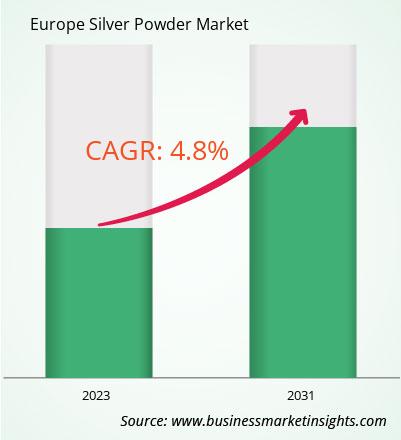
من المتوقع أن ينمو سوق مسحوق الفضة في أوروبا من 895.52 مليون دولار أمريكي في عام 2023 إلى 1299.16 مليون دولار أمريكي بحلول عام 2031. ومن المتوقع أن ينمو بمعدل نمو سنوي مركب قدره 4.8٪ من عام 2023 إلى عام 2031.
يشهد سوق مسحوق الفضة في أوروبا نموًا مطردًا، مدفوعًا بالطلب المتزايد على الطاقة الكهروضوئية والإلكترونيات. تنمو أوروبا مع سوق أشباه الموصلات سريعة التغير حيث تتبنى الحكومات في جميع أنحاء العالم بشكل متزايد سياسات أكثر تقييدًا بشأن استيراد واستخدام الرقائق من الخارج. أقرت المفوضية الأوروبية قانون رقائق الاتحاد الأوروبي في أبريل 2023 بهدف مضاعفة حصة الاتحاد الأوروبي في إنتاج الرقائق العالمي بحلول عام 2030 من خلال حشد 47 مليار دولار أمريكي من الاستثمارات العامة والخاصة. يؤدي نمو الإلكترونيات الاستهلاكية وتقنية الجيل الخامس والأجهزة القابلة للارتداء إلى زيادة الطلب على مسحوق الفضة في قطاع الإلكترونيات وأشباه الموصلات. إن التفضيل المتزايد للمكونات المصغرة يعزز بشكل أكبر من متطلبات مسحوق الفضة عالي النقاء. في قطاع الطاقة المتجددة، تُستخدم معاجين موصلة مصنوعة من مسحوق الفضة في الخلايا الكهروضوئية المدمجة في الألواح الشمسية. إن الدفع نحو مصادر الطاقة المتجددة في أوروبا مدفوع بأهداف ولوائح المناخ، مما يعود بالنفع بدوره على سوق مسحوق الفضة.
تشهد صناعة أشباه الموصلات نموًا مستمرًا بسبب الطلب المتزايد على الأجهزة الإلكترونية والتكامل المتزايد للذكاء الاصطناعي وإنترنت الأشياء (IoT) والإلكترونيات الخاصة بالسيارات. تؤدي الأنظمة المتقدمة التي تعمل بالذكاء الاصطناعي أو أجهزة الاستشعار الكمومية أو 5G/6G إلى زيادة تجارة الرقائق الإلكترونية ذات العقد 5 نانومتر و3 نانومتر وما فوق. تطورت تقنيات أشباه الموصلات بسرعة في السنوات القليلة الماضية، مما أتاح تطوير رقائق صغيرة وسريعة وكفؤة في استخدام الطاقة مع قدرات معالجة أفضل.
إن موصلية الفضة تجعلها لا تقدر بثمن في الإلكترونيات، مع تطبيقات تتراوح من المكثفات الخزفية متعددة الطبقات إلى الزجاج الأمامي المطلي بالفضة. يستخدم مسحوق الفضة في لوحات الدوائر المطبوعة (PCBs) والاتصالات الكهربائية للوحات مفاتيح الكمبيوتر. على لوحات الدوائر المطبوعة، يتم استخدامه لصنع مسارات موصلة. في الإلكترونيات والأجهزة عالية الأداء التي تعمل في درجات حرارة عالية، يساعد مسحوق الفضة في تبديد الحرارة بكفاءة، مما يحسن من موثوقية وعمر خدمة هذه الأجهزة.
بناءً على الشكل، يتم تقسيم سوق مسحوق الفضة في أوروبا إلى كروي ورقائقي وغير منتظم. في عام 2023، احتلت الشريحة الكروية حصة سوقية كبيرة خلال فترة التنبؤ. يستخدم مسحوق الفضة الكروي في الأحبار والمعاجين الموصلة للوحات الدوائر المطبوعة (PCBs) والمكونات الإلكترونية وخلايا الوقود والمكثفات الفائقة وأجهزة الاستشعار ومكونات أقطاب البطارية. علاوة على ذلك، من المتوقع أن يسجل قطاع الرقائق أسرع معدل نمو سنوي مركب خلال فترة التنبؤ. توفر رقائق مسحوق الفضة التحكم في مستويات النقاء الأيوني والخصائص الفيزيائية مثل الشكل ونسبة العرض إلى الارتفاع وحجم الجسيمات وتوزيع الحجم وطلاءات السطح. تُستخدم رقائق الفضة كمادة مضافة في الطلاءات الموصلة؛ ومفاتيح الغشاء؛ والأحبار الموصلة والمطاط والدهانات والبلاستيك.
Ames Goldsmith Corp وMETALOR Technologies SA وHeraeus Electronics GmbH & Co KG وNanoshel LLC وFENZI SpA وJohnson Matthey Plc وTechnic Inc وSAFINA AS وGiusto Manetti Battiloro SpA وLINBRAZE Srl، من بين اللاعبين الرائدين في سوق مسحوق الفضة في أوروبا. تتبنى هذه الشركات عمليات الدمج والاستحواذ وإطلاق المنتجات لتوسيع وجودها الجغرافي وقواعد المستهلكين.
تم تحديد حجم سوق مسحوق الفضة الإجمالي في أوروبا باستخدام المصادر الأولية والثانوية. لبدء عملية البحث، تم إجراء بحث ثانوي شامل باستخدام مصادر داخلية وخارجية للحصول على معلومات نوعية وكمية تتعلق بالسوق. كما تم إجراء مقابلات أولية متعددة مع المشاركين في الصناعة للتحقق من صحة البيانات واكتساب المزيد من الأفكار التحليلية. يشمل المشاركون في هذه العملية خبراء الصناعة مثل نواب الرئيس ومديري تطوير الأعمال ومديري استخبارات السوق ومديري المبيعات الوطنية - إلى جانب المستشارين الخارجيين، بما في ذلك خبراء التقييم ومحللي الأبحاث وقادة الرأي الرئيسيين - المتخصصين في سوق مسحوق الفضة في أوروبا.
Europe Silver Powder Strategic Insights
Strategic insights for Europe Silver Powder involve closely monitoring industry trends, consumer behaviours, and competitor actions to identify opportunities for growth. By leveraging data analytics, businesses can anticipate market shifts and make informed decisions that align with evolving customer needs. Understanding these dynamics helps companies adjust their strategies proactively, enhance customer engagement, and strengthen their competitive edge. Building strong relationships with stakeholders and staying agile in response to changes ensures long-term success in any market.
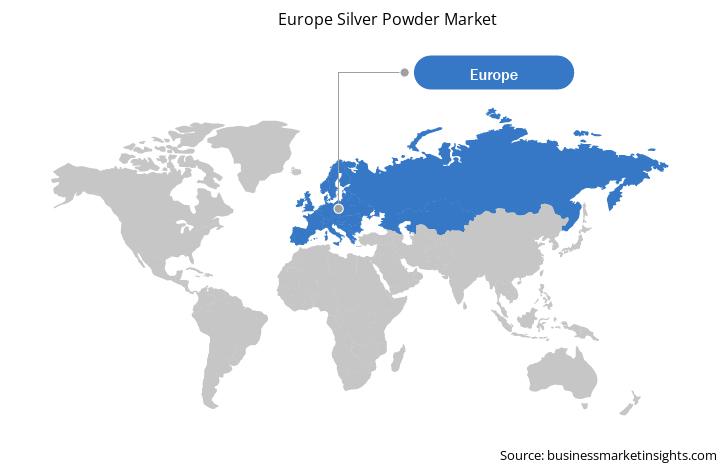
المملكة المتحدة، ألمانيا، فرنسا، روسيا، إيطاليا، بقية أوروبا
Market leaders and key company profiles
Ames Goldsmith Corp
METALOR Technologies SA
Heraeus Electronics GmbH & Co KG
Nanoshel LLC
FENZI SpA
Johnson Matthey Plc
Technic Inc
SAFINA AS
Giusto Manetti Battiloro SpA
LINBRAZE Srl
Get more information on this report
Europe Silver Powder Regional Insights
The regional scope of Europe Silver Powder refers to the geographical area in which a business operates and competes. Understanding regional nuances, such as local consumer preferences, economic conditions, and regulatory environments, is crucial for tailoring strategies to specific markets. Businesses can expand their reach by identifying underserved regions or adapting their offerings to meet regional demands. A clear regional focus allows for more effective resource allocation, targeted marketing, and better positioning against local competitors, ultimately driving growth in those specific areas.
Get more information on this report
The List of Companies - Europe Silver Powder Market
Ames Goldsmith Corp
METALOR Technologies SA
Heraeus Electronics GmbH & Co KG
Nanoshel LLC
FENZI SpA
Johnson Matthey Plc
Technic Inc
SAFINA AS
Giusto Manetti Battiloro SpA
LINBRAZE Srl
Frequently Asked Questions
How big is the Europe Silver Powder Market?
The Europe Silver Powder Market is valued at US$ 895.52 Million in 2023, it is projected to reach US$ 1,299.16 Million by 2031.
What is the CAGR for Europe Silver Powder Market by (2023 - 2031)?
As per our report Europe Silver Powder Market, the market size is valued at US$ 895.52 Million in 2023, projecting it to reach US$ 1,299.16 Million by 2031. This translates to a CAGR of approximately 4.8% during the forecast period.
What segments are covered in this report?
The Europe Silver Powder Market report typically cover these key segments-
طريقة الإنتاج (الاختزال الكيميائي، التحليل الكهربائي، الترسيب البخاري)
الشكل (كروي، رقائقي، غير منتظم)
حجم الجسيمات (جسيمات نانوية، دون الميكرون، مقياس الميكرون)
What is the historic period, base year, and forecast period taken for Europe Silver Powder Market?
The historic period, base year, and forecast period can vary slightly depending on the specific market research report. However, for the Europe Silver Powder Market report:
Historic Period : 2021-2022
Base Year : 2023
Forecast Period : 2024-2031
Who are the major players in Europe Silver Powder Market?
The Europe Silver Powder Market is populated by several key players, each contributing to its growth and innovation. Some of the major players include:
Ames Goldsmith Corp
METALOR Technologies SA
Heraeus Electronics GmbH & Co KG
Nanoshel LLC
FENZI SpA
Johnson Matthey Plc
Technic Inc
SAFINA AS
Giusto Manetti Battiloro SpA
LINBRAZE Srl
Who should buy this report?
The Europe Silver Powder Market report is valuable for diverse stakeholders, including:
Investors: Provides insights for investment decisions pertaining to market growth, companies, or industry insights. Helps assess market attractiveness and potential returns.
Industry Players: Offers competitive intelligence, market sizing, and trend analysis to inform strategic planning, product development, and sales strategies.
Suppliers and Manufacturers: Helps understand market demand for components, materials, and services related to concerned industry.
Researchers and Consultants: Provides data and analysis for academic research, consulting projects, and market studies.
Financial Institutions: Helps assess risks and opportunities associated with financing or investing in the concerned market.
Essentially, anyone involved in or considering involvement in the Europe Silver Powder Market value chain can benefit from the information contained in a comprehensive market report.
Personal & transactional information is kept safe from unauthorized use.
WHAT'S INCLUDED IN FULL REPORT : Market Dynamics,
Competitive Analysis and Assessment, Define Business Strategies, Market Outlook and
Trends, Market Size and Share Analysis, Growth Driving Factors, Future Commercial
Potential, Identify Regional Growth Engines


 Get Free Sample For Europe Silver Powder Market

