Analysis - by Type (Step Indexed Optical Fiber and Graded Indexed Optical Fiber), Mode (Single Mode and Multi-Mode), Composition (Glass and Plastic), and End User (Telecom and Networking, Industrial Automation, Medical, Defense, and Others)
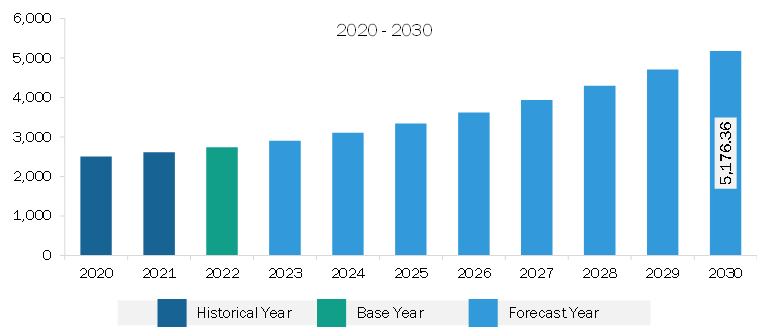
The Europe optical fiber market was valued at US$ 2,740.94 million in 2022 and is expected to reach US$ 5,176.36 million by 2030; it is estimated to record a CAGR of 8.3% from 2022 to 2030.
Widespread Implementation of 5G Drives Europe Optical Fiber Market
5G is the fifth generation of telecommunication networks and is considered a breakthrough in communication technology. It offers several benefits, such as high bandwidth, enhanced mobile broadband, lower latency, and higher data rates. To support these capabilities, a robust and reliable infrastructure is required, and optical fiber is a key component of this infrastructure. Optical fiber is a thin, flexible, and transparent fiber made of silica or plastic that can transmit data using light signals. It provides high-speed and high-capacity data transmission, making it ideal for supporting the increased demands of 5G networks. Optical fiber offers several advantages over traditional copper cables, including higher bandwidth, longer transmission distances, and immunity to electromagnetic interference.
The implementation of 5G technology requires a significant expansion of the existing network infrastructure. This includes the deployment of small cells and macro cells to ensure seamless coverage and capacity. Small cells are low-power base stations that are deployed in densely populated areas, while macro cells are larger base stations that cover larger areas. Both small cells and macro cells require high-speed and reliable backhaul connections, which can be efficiently provided by optical fiber.
As optical fiber provides larger bandwidth for longer distances and at faster speeds, it is expected to play a crucial role in supporting the high number of connected devices in 5G networks. Also, as optical fiber provides wide-area coverage and supports the bandwidth requirements of 5G networks, its demand in the market is increasing. Moreover, Ericsson has projected that by the end of 2028, the number of 5G subscriptions is anticipated to surpass 4.6 billion, representing more than 50% of total mobile subscriptions. As a result, there is a growing need for substantial optical fiber deployments in backhaul networks worldwide.
Europe Optical Fiber Market Overview
The Europe optical fiber market is segmented into France, Germany, Russia, Italy, the UK, and the Rest of Europe. The optical fiber market in Europe is witnessing rapid growth due to several factors such as the commercialization of high-speed networks, the increasing number of small and medium-sized businesses, and the rising demand for bandwidth and reliability across various industries. The market expansion is further driven by a rise in internet penetration, a surge in data traffic, and a rise in the implementation of the Internet of Things (IoT). Additionally, the rising popularity of online streaming services, video conferencing, and other bandwidth-intensive applications fuels the demand for high-speed internet in Europe. This increased demand is overburdening the capacity of existing copper-based networks, as they are unable to keep up with the bandwidth requirements.
In contrast, optical fiber offers significantly higher bandwidth capacity, making it the preferred solution to meet the surging demand for high-speed internet in Europe. Governments of many countries across Europe are providing financial support to facilitate the deployment of fiber optic networks, thereby accelerating their adoption in the region. Notably, the Europe optical fiber market is specifically designed for outdoor use, considering the challenging environmental conditions often encountered in the region. These outdoor fiber optics are constructed with materials that are resistant to water, corrosion, and other environmental factors. In Europe, optical fiber manufacturing companies also adhere to high manufacturing standards due to the imposition of stringent regulations. These regulations necessitate compliance with requirements related to performance, safety, and environmental impact. For instance, The European Electronic Communications Code (EECC) is a directive in EU law that updated the regulatory framework for communications services. The European Parliament adopted the EECC on June 6, 2018, and ordered EU member states to transpose the EECC provisions into their national laws by December 21, 2020. The EECC aims to harmonize the rules for electronic communications networks and services, promote competition and innovation, ensure consumer protection and access, and foster the development of the digital single market.
Europe Optical Fiber Market Revenue and Forecast to 2030 (US$ Million)
Europe Optical Fiber Market Segmentation
The Europe optical fiber market is segmented based on type, mode, composition, end user, and country. Based on type, the Europe optical fiber market is bifurcated into step indexed optical fiber and graded indexed optical fiber. The graded indexed optical fiber segment held a larger market share in 2022.
In terms of mode, the Europe optical fiber market is bifurcated into single mode and multi-mode. The single mode segment held a larger market share in 2022.
By composition the Europe optical fiber market is bifurcated into glass and plastic. The glass segment held a larger market share in 2022.
Based on end user, the Europe optical fiber market is categorized into the telecom and networking, industrial automation, medical, defense, and others. The telecom and networking segment held the largest market share in 2022.
Based on country, the Europe optical fiber market is segmented into France, Germany, the UK, Italy, Russia, and the Rest of Europe. The UK dominated the Europe optical fiber market share in 2022.
Corning Inc, Prysmian Spa, Jiangsu Zhogtian Technology Co Ltd, Yangtze Optical Fiber and Cable Joint Stock Ltd, Fiberhome Telecommunication Technologies Co Ltd, CommScope Holding Co Inc, Nexans SA, Furukawa Electric Co Ltd, Sumitomo Electric Industries Ltd, and Coherent Corp are some of the leading companies operating in the Europe optical fiber market.
Europe Optical Fiber Market Strategic Insights
Get more information on this report
Europe Optical Fiber Market Segmentation Analysis
Europe Optical Fiber Market Report Highlights
Europe Optical Fiber Report Scope
Report Attribute
Details
Market size in 2022
US$ 2,740.94 Million
Market Size by 2030
US$ 5,176.36 Million
CAGR (2022 - 2030)
8.3%
Historical Data
2020-2021
Forecast period
2023-2030
Segments Covered
By Type
Step Indexed Optical Fiber
Graded Indexed Optical Fiber
By Mode
Single Mode
Multi-Mode
By Composition
Glass
Plastic
By End User
Telecom and Networking
Industrial Automation
Medical
Defense
Regions and Countries Covered
Europe
UK, Germany, France, Russia, Italy, Rest of Europe
Market leaders and key company profiles
Corning Inc
Prysmian Spa
Jiangsu Zhogtian Technology Co Ltd
Yangtze Optical Fiber and Cable Joint Stock Ltd
Fiberhome Telecommunication Technologies Co Ltd
CommScope Holding Co Inc
Nexans SA
Furukawa Electric Co Ltd
Sumitomo Electric Industries Ltd
Coherent Corp
Get more information on this report
Europe Optical Fiber Market Country and Regional Insights
Get more information on this report
Identical Market Reports with other Region/Countries
The List of Companies - Europe Optical Fiber Market
1. Corning Inc2. Prysmian Spa3. Jiangsu Zhogtian Technology Co Ltd4. Yangtze Optical Fiber and Cable Joint Stock Ltd5. Fiberhome Telecommunication Technologies Co Ltd6. CommScope Holding Co Inc7. Nexans SA8. Furukawa Electric Co Ltd9. Sumitomo Electric Industries Ltd10. Coherent Corp
Frequently Asked Questions
How big is the Europe Optical Fiber Market?
The Europe Optical Fiber Market is valued at US$ 2,740.94 Million in 2022, it is projected to reach US$ 5,176.36 Million by 2030.
What is the CAGR for Europe Optical Fiber Market by (2022 - 2030)?
As per our report Europe Optical Fiber Market, the market size is valued at US$ 2,740.94 Million in 2022, projecting it to reach US$ 5,176.36 Million by 2030. This translates to a CAGR of approximately 8.3% during the forecast period.
What segments are covered in this report?
The Europe Optical Fiber Market report typically cover these key segments-
Type (Step Indexed Optical Fiber, Graded Indexed Optical Fiber)
Mode (Single Mode, Multi-Mode)
Composition (Glass, Plastic)
End User (Telecom and Networking, Industrial Automation, Medical, Defense)
What is the historic period, base year, and forecast period taken for Europe Optical Fiber Market?
The historic period, base year, and forecast period can vary slightly depending on the specific market research report. However, for the Europe Optical Fiber Market report:
Historic Period : 2020-2021
Base Year : 2022
Forecast Period : 2023-2030
Who are the major players in Europe Optical Fiber Market?
The Europe Optical Fiber Market is populated by several key players, each contributing to its growth and innovation. Some of the major players include:
Corning Inc
Prysmian Spa
Jiangsu Zhogtian Technology Co Ltd
Yangtze Optical Fiber and Cable Joint Stock Ltd
Fiberhome Telecommunication Technologies Co Ltd
CommScope Holding Co Inc
Nexans SA
Furukawa Electric Co Ltd
Sumitomo Electric Industries Ltd
Coherent Corp
Who should buy this report?
The Europe Optical Fiber Market report is valuable for diverse stakeholders, including:
Investors: Provides insights for investment decisions pertaining to market growth, companies, or industry insights. Helps assess market attractiveness and potential returns.
Industry Players: Offers competitive intelligence, market sizing, and trend analysis to inform strategic planning, product development, and sales strategies.
Suppliers and Manufacturers: Helps understand market demand for components, materials, and services related to concerned industry.
Researchers and Consultants: Provides data and analysis for academic research, consulting projects, and market studies.
Financial Institutions: Helps assess risks and opportunities associated with financing or investing in the concerned market.
Essentially, anyone involved in or considering involvement in the Europe Optical Fiber Market value chain can benefit from the information contained in a comprehensive market report.


 Get Free Sample For Europe Optical Fiber Market


