Analysis - by Type (Forklifts, Aisle Trucks, Tow Tractors, Container Handlers, and Others), Drive Type (Internal Combustion Engine, Battery-Operated, and Gas-Powered), Level of Autonomy (Non/Semi-autonomous and Autonomous), and Application (Manufacturing, Warehousing, and Others)
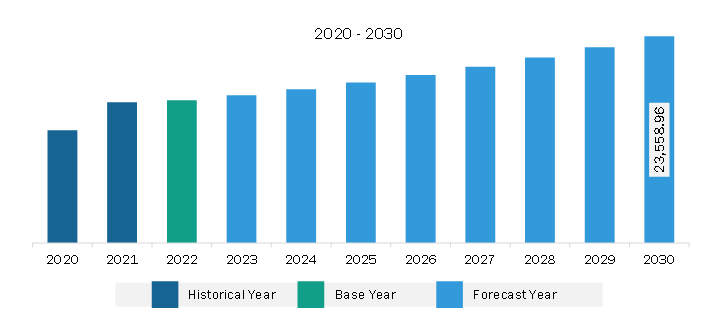
The Europe industrial vehicles market was valued at US$ 16,268.1 million in 2022 and is expected to reach US$ 23,559.0 million by 2030; it is estimated to register at a CAGR of 4.7% from 2022 to 2030.
Growth of E-commerce Drives Europe Industrial Vehicles Market
The e-commerce sector growth is characterized by a surge in online shopping, which boosts the need for streamlined warehouse operations. To achieve smooth operations, there is an increased demand for efficient and technologically advanced industrial vehicles. E-commerce giants and logistics providers are increasingly investing in state-of-the-art warehouses that rely heavily on industrial vehicles for material handling and storage. Forklifts, an integral component of these operations, are utilized to efficiently move and stack goods within expansive warehouse facilities. The demand for forklifts equipped with advanced features such as automation and telematics is growing as businesses strive to boost operational efficiency and meet the massive demands of online consumers.
Moreover, last-mile delivery has become a key concept in the logistics landscape, fueling the demand for specialized industrial vehicles. Delivery vans and vehicles equipped with advanced material handling capabilities are crucial for navigating the intricate logistics of delivering packages directly to the end consumer. As the customer's expectations for faster and more reliable deliveries continue to rise, the demand for innovative solutions that cater specifically to the challenges of last-mile delivery also increases. Industrial vehicles equipped with IoT (Internet of Things) devices, GPS tracking systems, and real-time monitoring capabilities enable precise tracking of inventory, optimize route planning, and enhance overall fleet management. This technological integration not only enhances operational efficiency but also contributes to cost savings and helps improve customer satisfaction.
Further, the need for flexibility and adaptability in industrial vehicle design is considered important. Manufacturers are focusing on developing versatile vehicles that can seamlessly integrate into diverse warehouse environments and accommodate varying load sizes. Customization options, such as adjustable lifting heights for forklifts and modular configurations for delivery vehicles, are becoming increasingly important to meet the unique requirements of different e-commerce and logistics operations. The demand for efficient warehouse operations and last-mile delivery solutions is driving innovation in industrial vehicle design and technology. Manufacturers that align their offerings with the evolving needs of the e-commerce and logistics sectors are poised to capitalize on this growth trajectory, solidifying their position in the market. Thus, the expansion of e-commerce and the dynamic evolution of logistics and supply chain operations are likely to create growth opportunities for the industrial vehicle market during the forecast period.
Europe Industrial Vehicles Market Overview
The rising demand for the material handling equipment and vehicles around the globe across the manufacturing sector drives the Europe industrial vehicles market growth. According to the World Industrial Vehicle Statistics Association (WITS), more than 2.34 million material-handling vehicles and equipment sales were recorded during 2021. The material handling industry saw a 43.0% increase in orders in 2021 compared to the previous year, 2020. Among the 2.34 million material handling units, around 68.8%, that is 1.61 million units, were recorded as electric-powered forklifts. Electric forklift demand is increasing at a rapid pace with a surge in consumer popularity. With a surge in the number of orders, the demand for industrial vehicles such as forklifts, aisle trucks, and pallet trucks has increased.
The industrial vehicle market in Europe is driven by the growing food & beverages sector, with increasing demand for logistics and transportation and rising shopping-commerce industry growth. The logistics sector requires industrial vehicles for the transport of goods from one place to another. According to the European Commission, it has invested US$ 6.59 billion for the 107 transport infrastructure projects. This EU's strategic investment was made to automate the transportation and logistics infrastructure. Such growth in the logistics sector has created massive demand for industrial vehicles for material handling in warehouses.
Europe Industrial Vehicles Market Revenue and Forecast to 2030 (US$ Million)
Europe Industrial Vehicles Market Segmentation
The Europe industrial vehicles market is segmented based on type, drive type, level of autonomy, application, and country.
Based on type, the Europe industrial vehicles market is segmented into forklifts, aisle trucks, tow tractors, container handlers, and others. The forklifts segment held the largest share in 2022.
In terms of drive type, the Europe industrial vehicles market is segmented into internal combustion engine, battery-operated, and gas-powered. The battery-operated segment held the largest share in 2022.
By level of autonomy, the Europe industrial vehicles market is bifurcated into non/semi-autonomous and autonomous. The non/semi-autonomous segment held a larger share in 2022.
Based on application, the Europe industrial vehicles market is segmented into manufacturing, warehousing, and others. The manufacturing segment held the largest share in 2022.
Based on country, the Europe industrial vehicles market is categorized into Germany, France, the UK, Italy, Spain, and the Rest of Europe. Germany dominated the Europe industrial vehicles market share in 2022.
Kion Group AG, Toyota Industries Corp, Mitsubishi Heavy Industries Ltd, Komatsu Ltd, Hyster-Yale Materials Handling Inc, Jungheinrich AG, Crown Equipment Corp, Konecranes Plc, and Anhui Heli Co Ltd are some of the leading companies operating in the Europe industrial vehicles market.
Europe Industrial Vehicles Market Strategic Insights
Get more information on this report
Europe Industrial Vehicles Market Segmentation Analysis
Europe Industrial Vehicles Market Report Highlights
Europe Industrial Vehicles Report Scope
Report Attribute
Details
Market size in 2022
US$ 16,268.1 Million
Market Size by 2030
US$ 23,559.0 Million
CAGR (2022 - 2030)
4.7%
Historical Data
2020-2021
Forecast period
2023-2030
Segments Covered
By Type
Forklifts
Aisle Trucks
Tow Tractors
Container Handlers
By Drive Type
Internal Combustion Engine
Battery-Operated
Gas-Powered
By Application
Manufacturing
Warehousing
Regions and Countries Covered
Europe
UK, Germany, France, Russia, Italy, Rest of Europe
Market leaders and key company profiles
Kion Group AG
Toyota Industries Corp
Mitsubishi Heavy Industries Ltd
Komatsu Ltd
Hyster-Yale Materials Handling Inc
Jungheinrich AG
Crown Equipment Corp
Konecranes Plc
Anhui Heli Co Ltd
Get more information on this report
Europe Industrial Vehicles Market Country and Regional Insights
Get more information on this report
Identical Market Reports with other Region/Countries
The List of Companies - Europe Industrial Vehicles Market
1. Kion Group AG2. Toyota Industries Corp3. Mitsubishi Heavy Industries Ltd4. Komatsu Ltd5. Hyster-Yale Materials Handling Inc6. Jungheinrich AG7. Crown Equipment Corp8. Konecranes Plc9. Anhui Heli Co Ltd
Frequently Asked Questions
How big is the Europe Industrial Vehicles Market?
The Europe Industrial Vehicles Market is valued at US$ 16,268.1 Million in 2022, it is projected to reach US$ 23,559.0 Million by 2030.
What is the CAGR for Europe Industrial Vehicles Market by (2022 - 2030)?
As per our report Europe Industrial Vehicles Market, the market size is valued at US$ 16,268.1 Million in 2022, projecting it to reach US$ 23,559.0 Million by 2030. This translates to a CAGR of approximately 4.7% during the forecast period.
What segments are covered in this report?
The Europe Industrial Vehicles Market report typically cover these key segments-
Type (Forklifts, Aisle Trucks, Tow Tractors, Container Handlers)
Drive Type (Internal Combustion Engine, Battery-Operated, Gas-Powered)
Application (Manufacturing, Warehousing)
What is the historic period, base year, and forecast period taken for Europe Industrial Vehicles Market?
The historic period, base year, and forecast period can vary slightly depending on the specific market research report. However, for the Europe Industrial Vehicles Market report:
Historic Period : 2020-2021
Base Year : 2022
Forecast Period : 2023-2030
Who are the major players in Europe Industrial Vehicles Market?
The Europe Industrial Vehicles Market is populated by several key players, each contributing to its growth and innovation. Some of the major players include:
Kion Group AG
Toyota Industries Corp
Mitsubishi Heavy Industries Ltd
Komatsu Ltd
Hyster-Yale Materials Handling Inc
Jungheinrich AG
Crown Equipment Corp
Konecranes Plc
Anhui Heli Co Ltd
Who should buy this report?
The Europe Industrial Vehicles Market report is valuable for diverse stakeholders, including:
Investors: Provides insights for investment decisions pertaining to market growth, companies, or industry insights. Helps assess market attractiveness and potential returns.
Industry Players: Offers competitive intelligence, market sizing, and trend analysis to inform strategic planning, product development, and sales strategies.
Suppliers and Manufacturers: Helps understand market demand for components, materials, and services related to concerned industry.
Researchers and Consultants: Provides data and analysis for academic research, consulting projects, and market studies.
Financial Institutions: Helps assess risks and opportunities associated with financing or investing in the concerned market.
Essentially, anyone involved in or considering involvement in the Europe Industrial Vehicles Market value chain can benefit from the information contained in a comprehensive market report.


 Get Free Sample For Europe Industrial Vehicles Market


