Analysis - by Operation (Transmission and Distribution), Equipment (Pipeline, Compressor Station, Metering Skids, and Others), and Application (Onshore and Offshore)
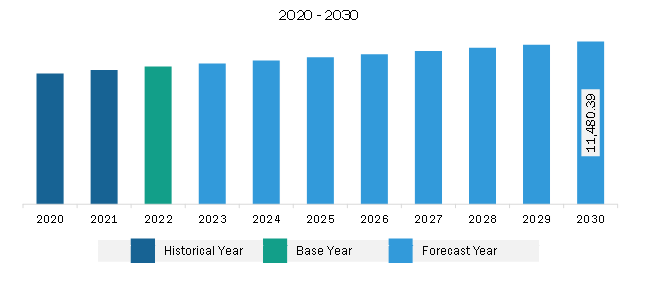
The Europe gas pipeline infrastructure market is expected to grow from US$ 9,715.58 billion in 2022 to US$ 11,480.39 billion by 2030. It is estimated to record a CAGR of 2.1% from 2022 to 2030.
Integration with Renewable Energy Drives Europe Gas Pipeline Infrastructure Market
Integration with renewable energy involves leveraging natural gas pipelines to support the intermittent nature of renewable sources such as solar and wind power. This integration offers opportunities for pipeline operators to collaborate with renewable energy developers and invest in infrastructure that complements renewable energy generation. For example, gas-fired power plants can provide backup and grid stability during periods of low renewable energy output, reducing reliance on fossil fuels and carbon emissions. Additionally, advancements in technologies like power-to-gas allow excess renewable energy to be converted into hydrogen or synthetic natural gas, which can be stored in pipelines for later use. By integrating natural gas pipelines with renewable energy sources, companies can contribute to decarbonization efforts, enhance energy security, and support the transition to a more sustainable energy system.
Europe Gas Pipeline Infrastructure Market Overview
Russia, Germany, France, and Spain are some of the major countries aiding to the overall growth of the gas pipeline infrastructure market in Europe. The government policies and mandates in line with the net zero carbon emission and clean energy targets are creating the demand for sustainable infrastructure, including gas pipeline networks. In the European Union, the carbon dioxide ratio in the power sector intensified substantially in 2022. A few countries resumed operations at coal-driven power plants, while outages at nuclear plants and low hydropower production fueled the dependability of natural gas. In line with the Paris Agreement, which involved 196 participants at the UN Climate Change Conference (COP21) in Paris, France, in 2015-the government is establishing net zero emission and green energy policies. The growing share of low-carbon emission energy resources in the power mix and the industrial sector are major driving factors for the gas pipeline infrastructure market in the region. The development of new pipeline infrastructure and the advancement of the capacity of existing gas pipelines are also likely to fuel the growth of the gas pipeline infrastructure market in Europe over the forecast period. Germany experienced slow growth in gas production until the end of 2022 due to the scarcity of gas resources across the country's mining areas. The country relies majorly on imports from different countries, such as the US, Italy, the UK, and Norway. It imports approximately 70% of its energy requirements as its domestic production caters to only ~6% of its gas consumption. In 2023, the governments of Germany and Italy collaborated to form a projected gas pipeline. The proposed pipeline is a 3,300 km project and is anticipated to incorporate four European transmission system operators, including Trans Austria Gasleitung, Snam, Bayernets, and Gas Connect Austria in Germany. Thus, the development of the new pipeline and maintenance of the existing gas network is anticipated to boost the development of gas pipeline infrastructure in Germany over the forecast period.
Europe Gas Pipeline Infrastructure Market Revenue and Forecast to 2030 (US$ Billion)
Europe Gas Pipeline Infrastructure Market Segmentation
Based on operation, the Europe gas pipeline infrastructure market is bifurcated into transmission and distribution. The distribution segment held a larger share of Europe gas pipeline infrastructure market in 2022.
In terms of equipment, the Europe gas pipeline infrastructure market is categorized into pipeline, compressor station, metering skids, and valves. The pipeline segment held the largest share of Europe gas pipeline infrastructure market in 2022.
Based on application, the Europe gas pipeline infrastructure market is bifurcated into onshore and offshore. The onshore segment held a larger share of Europe gas pipeline infrastructure market in 2022.
Based on country, the Europe gas pipeline infrastructure market is segmented into Germany, France, Italy, Spain, Russia, the UK, and the Rest of Europe. The Rest of Europe dominated the Europe gas pipeline infrastructure market in 2022.
Enbridge Inc, Berkshire Hathaway Inc, Kinder Morgan Inc, Beltps, Enagas SA, and Saipem SpA are some of the leading companies operating in the Europe gas pipeline infrastructure market.
Europe Gas Pipeline Infrastructure Market Strategic Insights
Get more information on this report
Europe Gas Pipeline Infrastructure Market Segmentation Analysis
Europe Gas Pipeline Infrastructure Market Report Highlights
Europe Gas Pipeline Infrastructure Report Scope
Report Attribute
Details
Market size in 2022
US$ 9,715.58 Billion
Market Size by 2030
US$ 11,480.39 Billion
CAGR (2022 - 2030)
2.1%
Historical Data
2020-2021
Forecast period
2023-2030
Segments Covered
By Operation
Transmission and Distribution
By Equipment
Pipeline
Compressor Station
Metering Skids
Regions and Countries Covered
Europe
UK, Germany, France, Russia, Italy, Rest of Europe
Market leaders and key company profiles
Enbridge Inc
Berkshire Hathaway Inc
Kinder Morgan Inc
Beltps
Enagas SA
Saipem SpA
Get more information on this report
Europe Gas Pipeline Infrastructure Market Country and Regional Insights
Get more information on this report
Identical Market Reports with other Region/Countries
The List of Companies - Europe Gas Pipeline Infrastructure Market
1. Enbridge Inc 2. Berkshire Hathaway Inc 3. Kinder Morgan Inc 4. Beltps 5. Enagas SA 6. Saipem SpA
Frequently Asked Questions
How big is the Europe Gas Pipeline Infrastructure Market?
The Europe Gas Pipeline Infrastructure Market is valued at US$ 9,715.58 Billion in 2022, it is projected to reach US$ 11,480.39 Billion by 2030.
What is the CAGR for Europe Gas Pipeline Infrastructure Market by (2022 - 2030)?
As per our report Europe Gas Pipeline Infrastructure Market, the market size is valued at US$ 9,715.58 Billion in 2022, projecting it to reach US$ 11,480.39 Billion by 2030. This translates to a CAGR of approximately 2.1% during the forecast period.
What segments are covered in this report?
The Europe Gas Pipeline Infrastructure Market report typically cover these key segments-
What is the historic period, base year, and forecast period taken for Europe Gas Pipeline Infrastructure Market?
The historic period, base year, and forecast period can vary slightly depending on the specific market research report. However, for the Europe Gas Pipeline Infrastructure Market report:
Historic Period : 2020-2021
Base Year : 2022
Forecast Period : 2023-2030
Who are the major players in Europe Gas Pipeline Infrastructure Market?
The Europe Gas Pipeline Infrastructure Market is populated by several key players, each contributing to its growth and innovation. Some of the major players include:
Enbridge Inc
Berkshire Hathaway Inc
Kinder Morgan Inc
Beltps
Enagas SA
Saipem SpA
Who should buy this report?
The Europe Gas Pipeline Infrastructure Market report is valuable for diverse stakeholders, including:
Investors: Provides insights for investment decisions pertaining to market growth, companies, or industry insights. Helps assess market attractiveness and potential returns.
Industry Players: Offers competitive intelligence, market sizing, and trend analysis to inform strategic planning, product development, and sales strategies.
Suppliers and Manufacturers: Helps understand market demand for components, materials, and services related to concerned industry.
Researchers and Consultants: Provides data and analysis for academic research, consulting projects, and market studies.
Financial Institutions: Helps assess risks and opportunities associated with financing or investing in the concerned market.
Essentially, anyone involved in or considering involvement in the Europe Gas Pipeline Infrastructure Market value chain can benefit from the information contained in a comprehensive market report.


 Get Free Sample For Europe Gas Pipeline Infrastructure Market


