Analysis - by Operation Type (Cylindrical Worm Gear and Single and Double Enveloping Worm Gear), Product Type (Housed Units, Gearsets, and High Speed Worms), and Material Type (Stainless Steel, Cast Iron, Aluminum, and Others)
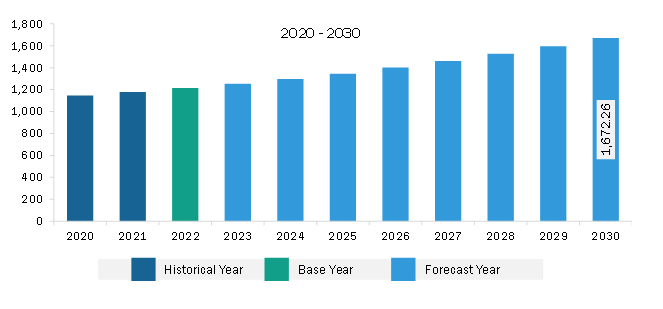
The Asia Pacific worm gear drives market was valued at US$ 1,213.77 million in 2022 and is expected to reach US$ 1,672.26 million by 2030; it is estimated to register a CAGR of 4.1% from 2022 to 2030.
Rise in Adoption of Robotics Boosts Asia Pacific Worm Gear Drives Market
Robotics is one of the areas that hold significant potential for the growth of worm gear drive vendors. As robots are becoming more prominent in industrial settings, the demand for high-performance gear systems is also expected to continue an upward trajectory in the coming years. Worm gear drives enable precise motion control, facilitating the accurate positioning and controlled movement of robotic devices. The combination of worm thread and worm wheel teeth enables fine adjustments and smooth operation, resulting in precise and repeatable movements. Worm gear drives provide large gear reduction ratios in a single stage , making them ideal for applications requiring low speed and high torque output. This allows robots in industrial material handling and assembly processes to execute jobs with precise control and large weight-handling capacities. Increasing investments by manufacturers across the world in the adoption of industrial robots is likely to generate lucrative opportunities for worm gear drives market growth. In October 2023, Volvo signed a deal with Fanuc for the industrial robot deployment. Under the terms of the agreement, Fanuc will supply industrial robots to Volvo's global manufacturing facilities. In the first phase, Fanuc would supply more than 700 robots to Volvo's planned electric vehicle (EV) manufacturing facility in Kosice, Slovakia, as well as sites in Ghent, Belgium, and Daqing, China. The announcement is a part of Volvo's larger green plan, which includes producing solely electric vehicles by 2030 and becoming carbon neutral by 2040. This aim emphasizes the utilization of automation technology, such as Fanuc industrial robots, and the Slovakian factory would serve as Volvo's first carbon-neutral production site. In addition to manufacturers' investments in the deployment of industrial robotics, the flourishing trend of Industry 4.0 is another factor that propels the adoption of automation technologies and robotics, which is further expected to benefit the worm gear drive industry.
Asia Pacific Worm Gear Drives Market Overview
India, China, and Australia are among the key contributors to the worm gear drive market in Asia Pacific (APAC). The region's commitment to technological advancements, coupled with growing investments in manufacturing and automotive sectors, is likely to drive the worm gear drive market to sustainable growth. As APAC continues to evolve as a key manufacturing landscape worldwide, the demand for efficient and reliable power transmission systems, e.g., worm gear drives, is set to surge in the coming years.
In India, the robust performance of the automotive sector and government emphasis on domestic manufacturing create a conducive environment for the growth of this market. The automotive industry accounts for a significant portion of the manufacturing GDP in the country. Additionally, the Production-Linked Incentive (PLI) Scheme and other government schemes further stimulate the manufacturing sector, potentially leading to increased adoption of advanced power transmission systems.
China, being a globally renowned manufacturing powerhouse, plays a pivotal role in shaping the industrial landscape of APAC. The ambitious "Made in China 2025" initiative, which focuses on technological advancement and self-reliance, contributes notably to the worm gear drives market. The substantial financial backing from the Chinese government and emphasis on indigenous innovation create opportunities for suppliers in the worm gear drive market to cater to the evolving needs of China's advanced manufacturing industries.
Australia, with its strong automotive and manufacturing industry, contributes significantly to the growth of the worm gear drive market in APAC. The country's automotive component industry has experienced substantial turnover, and the government's initiatives such as the Modern Manufacturing Strategy (MMS) Scheme boost domestic manufacturing. The localization efforts by global OEMs in Australia also enhance the demand for precision components, including worm gear drives, within the automotive supply chain.
Asia Pacific Worm Gear Drives Market Revenue and Forecast to 2030 (US$ Million)
Based on operation type, the Asia Pacific worm gear drives market is bifurcated into cylindrical worm gears and single and double enveloping worm gears. The cylindrical worm gears segment held a larger market share in 2022.
In terms of product type, the Asia Pacific worm gear drives market is categorized into housed units, gearsets, and high speed worms. The gearsets segment held the largest market share in 2022.
By material type, the Asia Pacific worm gear drives market is segmented into stainless steel, cast iron, aluminum, and others. The stainless steel segment held the largest market share in 2022.
By country, the Asia Pacific worm gear drives market is segmented into Australia, China, India, Japan, South Korea, and the Rest of Asia Pacific. China dominated the Asia Pacific worm gear drives market share in 2022.
Kohara Gear Industry Co Ltd, Tulsa Winch Inc, Nozag AG, The Timken Co, and Tracey Gear Inc are some of the leading companies operating in the Asia Pacific worm gear drives market.
Asia Pacific Worm Gear Drives Market Strategic Insights
Get more information on this report
Asia Pacific Worm Gear Drives Market Segmentation Analysis
Asia Pacific Worm Gear Drives Market Report Highlights
Asia Pacific Worm Gear Drives Report Scope
Report Attribute
Details
Market size in 2022
US$ 1,213.77 Million
Market Size by 2030
US$ 1,672.26 Million
CAGR (2022 - 2030)
4.1%
Historical Data
2020-2021
Forecast period
2023-2030
Segments Covered
By Operation Type
Cylindrical Worm Gear and Single and Double Enveloping Worm Gear
By Product Type
Housed Units
Gearsets
High Speed Worms
Regions and Countries Covered
Asia-Pacific
China, India, Japan, Australia, Rest of Asia-Pacific
Market leaders and key company profiles
Kohara Gear Industry Co Ltd.
Tulsa Winch Inc.
Nozag AG.
The Timken Co.
Tracey Gear Inc.
Get more information on this report
Asia Pacific Worm Gear Drives Market Country and Regional Insights
Get more information on this report
Identical Market Reports with other Region/Countries
The List of Companies - Asia Pacific Worm Gear Drives Market
1. Kohara Gear Industry Co Ltd.2. Tulsa Winch Inc.3. Nozag AG.4. The Timken Co.5. Tracey Gear Inc.
About Author— Manufacturing and Construction Research Team
Shivani Singh is a market research professional with expertise in secondary research, competitive intelligence, and industry analysis. She contributes to developing comprehensive market insights and business intelligence that support strategic decision-making across diverse industries.
With a strong analytical mindset and attention to detail, she specializes in data interpretation, market trend evaluation, and report development. Her ability to synthesize complex information into actionable insights, combined with effective communication and research execution, enables the delivery of high-quality, client-focused market research so..
Show More
Frequently Asked Questions
How big is the Asia Pacific Worm Gear Drives Market?
The Asia Pacific Worm Gear Drives Market is valued at US$ 1,213.77 Million in 2022, it is projected to reach US$ 1,672.26 Million by 2030.
What is the CAGR for Asia Pacific Worm Gear Drives Market by (2022 - 2030)?
As per our report Asia Pacific Worm Gear Drives Market, the market size is valued at US$ 1,213.77 Million in 2022, projecting it to reach US$ 1,672.26 Million by 2030. This translates to a CAGR of approximately 4.1% during the forecast period.
What segments are covered in this report?
The Asia Pacific Worm Gear Drives Market report typically cover these key segments-
Operation Type (Cylindrical Worm Gear and Single and Double Enveloping Worm Gear)
Product Type (Housed Units, Gearsets, High Speed Worms)
What is the historic period, base year, and forecast period taken for Asia Pacific Worm Gear Drives Market?
The historic period, base year, and forecast period can vary slightly depending on the specific market research report. However, for the Asia Pacific Worm Gear Drives Market report:
Historic Period : 2020-2021
Base Year : 2022
Forecast Period : 2023-2030
Who are the major players in Asia Pacific Worm Gear Drives Market?
The Asia Pacific Worm Gear Drives Market is populated by several key players, each contributing to its growth and innovation. Some of the major players include:
Kohara Gear Industry Co Ltd.
Tulsa Winch Inc.
Nozag AG.
The Timken Co.
Tracey Gear Inc.
Who should buy this report?
The Asia Pacific Worm Gear Drives Market report is valuable for diverse stakeholders, including:
Investors: Provides insights for investment decisions pertaining to market growth, companies, or industry insights. Helps assess market attractiveness and potential returns.
Industry Players: Offers competitive intelligence, market sizing, and trend analysis to inform strategic planning, product development, and sales strategies.
Suppliers and Manufacturers: Helps understand market demand for components, materials, and services related to concerned industry.
Researchers and Consultants: Provides data and analysis for academic research, consulting projects, and market studies.
Financial Institutions: Helps assess risks and opportunities associated with financing or investing in the concerned market.
Essentially, anyone involved in or considering involvement in the Asia Pacific Worm Gear Drives Market value chain can benefit from the information contained in a comprehensive market report.


 Get Free Sample For Asia Pacific Worm Gear Drives Market


