Analysis - by Fiber Type (Carbon Fiber Composites, Glass Fiber Composites, and Others), Resin Type (Polyester, Epoxy, Polyurethane, Vinyl Ester, and Others), Technology (Resin Infusion, Prepreg, Lay Up, and Others), and Application (Blades and Nacelles)
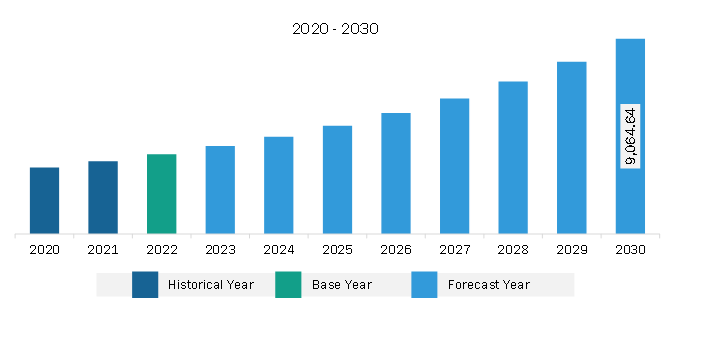
The Asia Pacific wind turbine composites market was valued at US$ 3,698.92 million in 2022 and is expected to reach US$ 9,064.64 million by 2030; it is estimated to record a CAGR of 11.9% from 2022 to 2030.
Adoption of Natural Fiber Reinforced Polymer (NFRP) Composites Boosts Asia Pacific Wind Turbine Composites Market
A wind turbine consists of several parts such as a hub, gearbox, blades, nacelle, and tower, among which wind turbine blades and nacelle are generally composed of composite materials, including glass and carbon fibers. However, these kinds of fibers are often associated with a certain set of limitations, which include their availability, nonbiodegradability, harmful impact on health, and the fabrication cost involved. The use of natural fibers can overcome all these challenges. The growing environmental issues have shifted the attention of researchers and technologists to the use of natural biodegradable materials, which has bolstered the use of natural fiber-reinforced polymer (NFRP) composites in wind turbine manufacturing.
Natural fibers are defined as those substances which are made from plants, animals, and minerals with the help of geological processes. Natural fibers obtained from kenaf, bagasse, banana, sisal, flax, hemp, jute, abaca, and bamboo are easily available and need low processing costs. They can be spun together into filaments, threads, or ropes and can be knitted, woven, or matted.
The characteristic features of natural fibers might vary considerably according to their chemical composition and structure; fiber type; and fiber's growing conditions, harvesting time, manufacturing method, treatment, and storage processes. Such reinforced composites form a class of materials that exhibit superior mechanical features as well as potentially replace the conventional material systems in wind turbines.
The NFRP composites possess certain advantages as compared to synthetic fiber-reinforced composites. These benefits include low density, minimal cost, nonabrasive features, biodegradability, and renewable nature. Hence, the rising concern and awareness about the social and environmental impacts of conventional materials are resulting in the shift toward environment-friendly materials by manufacturers of composites, which is expected to fuel the wind turbine composites market growth during the forecast period.
Asia Pacific Wind Turbine Composites Market Overview
The wind turbine composites market in Asia Pacific is segmented into Australia, China, India, Japan, South Korea, and the Rest of Asia Pacific. China is a major contributor to the market growth in this region. The country has been the largest and fastest-growing renewable energy producer for more than a decade across the world. Moreover, it has the world's largest wind energy market. China remained the world's largest market for new onshore additions in 2020, driven by the feed-in tariff (FiT) cut-off. The wind power industry in India also records a remarkable growth due to policies and regulations adopted by the union and state governments. In Japan, the government has set the target of 10 GW of offshore wind installation by 2030 and 30-45 GW by 2040. According to the IEA Wind TCP, Japan's wind power capacity reached 4,581 MW in the end of 2021. The Japan Wind Power Association stated that the country installed 232.9 MW of new wind capacity in 2022, bringing the total capacity in operation to 4,802 MW. Thus, the increasing installed wind capacity in China, Japan, India, Australia, and others drives the demand for wind turbine composites. Countries such as Taiwan, South Korea, Vietnam, and the Philippines are also taking various initiatives to install new wind capacities, adding to the region's demand for wind turbine composites.
Asia Pacific Wind Turbine Composites Market Revenue and Forecast to 2030 (US$ Million)
Asia Pacific Wind Turbine Composites Market Segmentation
Based on fiber type, the Asia Pacific wind turbine composites market is segmented into carbon fiber composites, glass fiber composites, and others. The glass fiber composites segment held a larger share in 2022.
In terms of resin type, the Asia Pacific wind turbine composites market is segmented into polyester, epoxy, polyurethane, vinyl ester, and others. The epoxy segment held the largest share in 2022.
Based on technology, the Asia Pacific wind turbine composites market is segmented into resin infusion, prepreg, lay up, and others. The resin infusion segment held the largest share in 2022.
By application, the Asia Pacific wind turbine composites market is bifurcated into blades and nacelles. The blades segment held a larger share in 2022.
Based on country, the Asia Pacific wind turbine composites market is segmented into Australia, China, India, Japan, South Korea, and the Rest of Asia Pacific. China dominated the Asia Pacific wind turbine composites market in 2022.
Avient Corp, Toray Industries Inc, SGL Carbon SE, Owens Corning, Gurit Holding AG, Covestro AG, Hexion Inc, EPSILON Composite SA, Exel Composites Oyj, and Hexcel Corp are some of the leading companies operating in the Asia Pacific wind turbine composites market.
Asia Pacific Wind Turbine Composites Market Strategic Insights
Get more information on this report
Asia Pacific Wind Turbine Composites Market Segmentation Analysis
Asia Pacific Wind Turbine Composites Market Report Highlights
Asia Pacific Wind Turbine Composites Report Scope
Report Attribute
Details
Market size in 2022
US$ 3,698.92 Million
Market Size by 2030
US$ 9,064.64 Million
CAGR (2022 - 2030)
11.9%
Historical Data
2020-2021
Forecast period
2023-2030
Segments Covered
By Fiber Type
Carbon Fiber Composites
Glass Fiber Composites
By Resin Type
Polyester
Epoxy
Polyurethane
Vinyl Ester
By Technology
Resin Infusion
Prepreg
Lay Up
By Application
Blades
Nacelles
Regions and Countries Covered
Asia-Pacific
China, India, Japan, Australia, Rest of Asia-Pacific
Market leaders and key company profiles
Avient Corp
Toray Industries Inc
SGL Carbon SE
Owens Corning
Gurit Holding AG
Covestro AG - Global
Hexion Inc - Global
Hexcel Corp
Exel Composites Oyj
Get more information on this report
Asia Pacific Wind Turbine Composites Market Country and Regional Insights
Get more information on this report
Identical Market Reports with other Region/Countries
The List of Companies - Asia Pacific Wind Turbine Composites Market
1. Avient Corp2. Toray Industries Inc3. SGL Carbon SE4. Owens Corning5. Gurit Holding AG6. Covestro AG - Global7. Hexion Inc - Global8. Hexcel Corp9. Exel Composites Oyj
Frequently Asked Questions
How big is the Asia Pacific Wind Turbine Composites Market?
The Asia Pacific Wind Turbine Composites Market is valued at US$ 3,698.92 Million in 2022, it is projected to reach US$ 9,064.64 Million by 2030.
What is the CAGR for Asia Pacific Wind Turbine Composites Market by (2022 - 2030)?
As per our report Asia Pacific Wind Turbine Composites Market, the market size is valued at US$ 3,698.92 Million in 2022, projecting it to reach US$ 9,064.64 Million by 2030. This translates to a CAGR of approximately 11.9% during the forecast period.
What segments are covered in this report?
The Asia Pacific Wind Turbine Composites Market report typically cover these key segments-
Fiber Type (Carbon Fiber Composites, Glass Fiber Composites)
Resin Type (Polyester, Epoxy, Polyurethane, Vinyl Ester)
Technology (Resin Infusion, Prepreg, Lay Up)
Application (Blades, Nacelles)
What is the historic period, base year, and forecast period taken for Asia Pacific Wind Turbine Composites Market?
The historic period, base year, and forecast period can vary slightly depending on the specific market research report. However, for the Asia Pacific Wind Turbine Composites Market report:
Historic Period : 2020-2021
Base Year : 2022
Forecast Period : 2023-2030
Who are the major players in Asia Pacific Wind Turbine Composites Market?
The Asia Pacific Wind Turbine Composites Market is populated by several key players, each contributing to its growth and innovation. Some of the major players include:
Avient Corp
Toray Industries Inc
SGL Carbon SE
Owens Corning
Gurit Holding AG
Covestro AG - Global
Hexion Inc - Global
Hexcel Corp
Exel Composites Oyj
Who should buy this report?
The Asia Pacific Wind Turbine Composites Market report is valuable for diverse stakeholders, including:
Investors: Provides insights for investment decisions pertaining to market growth, companies, or industry insights. Helps assess market attractiveness and potential returns.
Industry Players: Offers competitive intelligence, market sizing, and trend analysis to inform strategic planning, product development, and sales strategies.
Suppliers and Manufacturers: Helps understand market demand for components, materials, and services related to concerned industry.
Researchers and Consultants: Provides data and analysis for academic research, consulting projects, and market studies.
Financial Institutions: Helps assess risks and opportunities associated with financing or investing in the concerned market.
Essentially, anyone involved in or considering involvement in the Asia Pacific Wind Turbine Composites Market value chain can benefit from the information contained in a comprehensive market report.


 Get Free Sample For Asia Pacific Wind Turbine Composites Market


