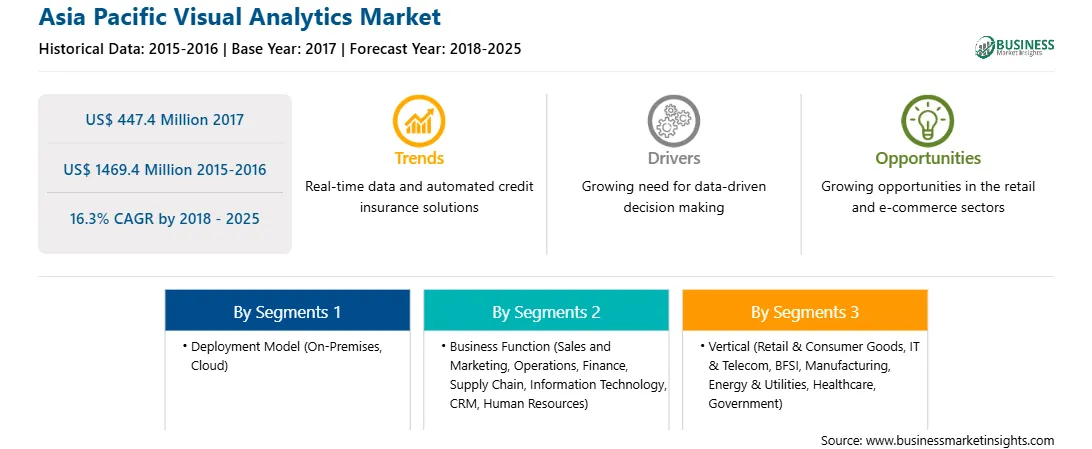
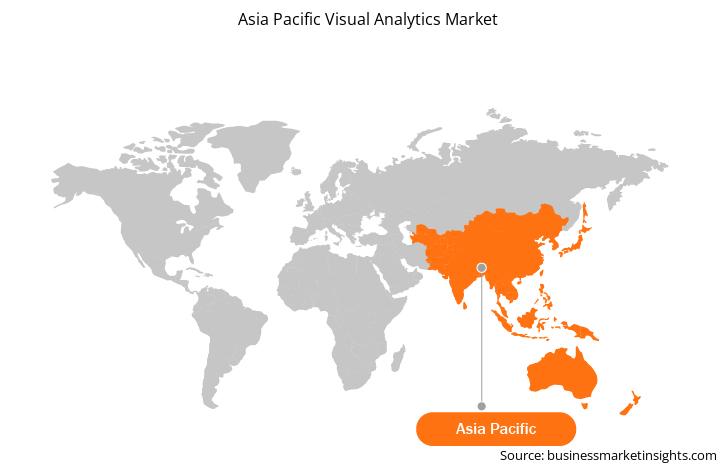
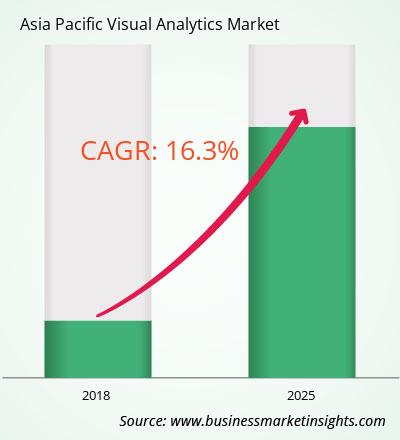
سوق التحليلات المرئية في منطقة آسيا والمحيط الهادئ حتى عام 2025 – التحليل والتنبؤات الإقليمية حسب نموذج النشر (محليًا وسحابيًا)؛ وظيفة الأعمال (المبيعات والتسويق، والعمليات، والمالية، وسلسلة التوريد، وتكنولوجيا المعلومات، وإدارة علاقات العملاء، والموارد البشرية)؛ عمودي (سلع التجزئة والسلع الاستهلاكية، وتكنولوجيا المعلومات والاتصالات، وBFSI، والتصنيع، والطاقة والمرافق، والرعاية الصحية، والحكومة)

Historic Data: 2015-2016   |   Base Year: 2017   |   Forecast Period: 2018-2025


No. of Pages: 138    |    Report Code: TIPRE00005052    |    Category: Technology, Media and Telecommunications

Asia Pacific Visual Analytics Market

من المتوقع أن ينمو سوق التحليلات المرئية في منطقة آسيا والمحيط الهادئ من 447.4 مليون دولار أمريكي في عام 2017 إلى 1469.4 مليون دولار أمريكي بحلول عام 2025. ويمثل هذا معدل نمو سنوي مركب قدره 16.3% من عام 2018 إلى 2025.

أصبح من الضروري أكثر بالنسبة للمؤسسات تشغيل كل من وظائف الأعمال الأساسية وغير الأساسية من خلال السحابة، وتماشيًا مع هذا، ستتخذ الشركات خطوة لإسكان كل شيء في مكان واحد بشكل أسرع. إن مزايا الحركة تتحدث عن نفسها، حيث أن استخدام السحابة يعمل على تحسين إدارة البيانات وتبسيط العمليات وإدارة المخاطر. تلك المنظمات المترددة في التحول إلى التكامل الكامل سوف تجد نفسها بسرعة في موقف دفاعي حيث يصر المستثمرون بشكل متزايد على السحابة كمصطلح للاستثمار. تعمل السحابة على تحويل الشركات إلى آلات بسيطة وفعالة، لذلك سيصبح من غير القابل للتفاوض بالنسبة للشركات أن تعمل في السحابة إذا أرادت أن تظل قادرة على المنافسة.

الصين هي الدولة الأكثر سكانا في العالم. إن وجود الصناعات التحويلية المتقدمة والطلب المتزايد على المدن الذكية يوفر بيئة مناسبة لاعتماد التكنولوجيا المتقدمة. ومع ذلك، فإن الصين تنتقل من كونها دولة عمالة منخفضة التكلفة وتستثمر بكثافة في التحول الرقمي للاحتفاظ بلقبها كمركز للتصنيع. يتأثر نمو سوق التحليلات المرئية في الصين بشكل كبير بالمبادرات الحكومية المختلفة في البلاد والتي من المتوقع أن تتوقع الصين نموًا بنسبة 8.5٪ على أساس سنوي في الإنفاق على البرمجيات. تشمل المبادرات الحكومية في الدولة الصناعة 4.0 وإنترنت بلس الذي يدمج تكنولوجيا المعلومات مع التصنيع. كما اقترحت الحكومة 46 مشروعًا تجريبيًا ستركز على الابتكار لتنفيذ التصنيع الذكي كجزء من مبادرتها \"صنع في الصين 2025\". مما سيزيد من الطلب على الحلول التي تدعم التعلم الآلي. وبالتالي، تتوقع المنطقة التطوير المتزايد واعتماد الحلول التحليلية المرئية في فترة التوقعات. ولذلك، من المتوقع أن تتبنى المنطقة الحلول التحليلية المرئية بسرعة خلال فترة التوقعات. يسلط الشكل الموضح أدناه الضوء على حصة إيرادات أستراليا في سوق التحليلات المرئية في منطقة آسيا والمحيط الهادئ في فترة التوقعات:

المعرض: إيرادات سوق التحليلات المرئية في أستراليا والتوقعات حتى عام 2025 (مليار دولار أمريكي)

سوق التحليلات المرئية في منطقة آسيا والمحيط الهادئ حسب نموذج النشر

• السحابة
• داخل الشركة

سوق التحليلات المرئية في منطقة آسيا والمحيط الهادئ حسب وظيفة الأعمال

• المبيعات والتسويق
• العمليات
• المالية
• سلسلة التوريد
• تكنولوجيا المعلومات
• إدارة علاقات العملاء
• الموارد البشرية
• أخرى

سوق التحليلات المرئية في آسيا والمحيط الهادئ حسب الوضع الرأسي

• البيع بالتجزئة & أمبير؛ سوق السلع الاستهلاكية
• تكنولوجيا المعلومات & الاتصالات
• بفسي
• التصنيع
• الطاقة والأمبير. المرافق
• الرعاية الصحية
• الحكومة
• أخرى

سوق التحليلات المرئية في منطقة آسيا والمحيط الهادئ حسب الدولة

• الصين
• الهند
• أستراليا
• اليابان
• بقية دول آسيا والمحيط الهادئ

الشركات المذكورة

• ALTERYX, INC.
• شركة IBM
• شركة مايكروسوفت
• ميكروستراتيغي إنكوربوريتد
• شركة أوراكل
• QLIK TECHNOLOGIES INC
• SAP SE
• SAS INSTITUTE INC.
• برنامج التابلو
• شركة تيبكو للبرمجيات


Asia Pacific Visual Analytics Strategic Insights

Strategic insights for Asia Pacific Visual Analytics involve closely monitoring industry trends, consumer behaviours, and competitor actions to identify opportunities for growth. By leveraging data analytics, businesses can anticipate market shifts and make informed decisions that align with evolving customer needs. Understanding these dynamics helps companies adjust their strategies proactively, enhance customer engagement, and strengthen their competitive edge. Building strong relationships with stakeholders and staying agile in response to changes ensures long-term success in any market.

strategic-framework/asia-pacific-visual-analytics-market-strategic-framework.webp
Get more information on this report

Asia Pacific Visual Analytics Report Scope

Report Attribute Details
Market size in 2017 US$ 447.4 Million
Market Size by 2025 US$ 1469.4 Million
Global CAGR (2018 - 2025) 16.3%
Historical Data 2015-2016
Forecast period 2018-2025
Segments Covered By نموذج النشر
  • محليًا، سحابيًا
By وظيفة الأعمال
  • المبيعات والتسويق، العمليات، المالية، سلسلة التوريد، تكنولوجيا المعلومات، إدارة علاقات العملاء، الموارد البشرية
By عمودي
  • التجزئة والسلع الاستهلاكية، وتكنولوجيا المعلومات والاتصالات، والخدمات المصرفية والمالية والتأمين، والتصنيع، والطاقة والمرافق، والرعاية الصحية، والحكومة
Regions and Countries Covered آسيا والمحيط الهادئ
  • الصين والهند واليابان وأستراليا وبقية دول آسيا والمحيط الهادئ
Market leaders and key company profiles
  • ALTERYX, INC.
  • IBM CORPORATION
  • Microsoft Corporation
  • MICROSTRATEGY INCORPORATED
  • ORACLE CORPORATION
  • QLIK TECHNOLOGIES INC
  • SAP SE
  • SAS INSTITUTE INC.
  • Tableau Software
  • TIBCO SOFTWARE INC.
  • Get more information on this report

    Asia Pacific Visual Analytics Regional Insights

    The regional scope of Asia Pacific Visual Analytics refers to the geographical area in which a business operates and competes. Understanding regional nuances, such as local consumer preferences, economic conditions, and regulatory environments, is crucial for tailoring strategies to specific markets. Businesses can expand their reach by identifying underserved regions or adapting their offerings to meet regional demands. A clear regional focus allows for more effective resource allocation, targeted marketing, and better positioning against local competitors, ultimately driving growth in those specific areas.

    geography/asia-pacific-visual-analytics-market-geography.webp
    Get more information on this report

    The List of Companies - Asia Pacific Visual Analytics Market

    The List of Companies

    1. ALTERYX, INC.
    2. IBM CORPORATION
    3. Microsoft Corporation
    4. MICROSTRATEGY INCORPORATED
    5. ORACLE CORPORATION
    6. QLIK TECHNOLOGIES INC
    7. SAP SE
    8. SAS INSTITUTE INC.
    9. Tableau Software
    10. TIBCO SOFTWARE INC.
    Frequently Asked Questions
    How big is the Asia Pacific Visual Analytics Market?

    The Asia Pacific Visual Analytics Market is valued at US$ 447.4 Million in 2017, it is projected to reach US$ 1469.4 Million by 2025.

    What is the CAGR for Asia Pacific Visual Analytics Market by (2018 - 2025)?

    As per our report Asia Pacific Visual Analytics Market, the market size is valued at US$ 447.4 Million in 2017, projecting it to reach US$ 1469.4 Million by 2025. This translates to a CAGR of approximately 16.3% during the forecast period.

    What segments are covered in this report?

    The Asia Pacific Visual Analytics Market report typically cover these key segments-

  • نموذج النشر (محليًا، سحابيًا)
  • وظيفة الأعمال (المبيعات والتسويق، العمليات، المالية، سلسلة التوريد، تكنولوجيا المعلومات، إدارة علاقات العملاء، الموارد البشرية)
  • عمودي (التجزئة والسلع الاستهلاكية، وتكنولوجيا المعلومات والاتصالات، والخدمات المصرفية والمالية والتأمين، والتصنيع، والطاقة والمرافق، والرعاية الصحية، والحكومة)
  • What is the historic period, base year, and forecast period taken for Asia Pacific Visual Analytics Market?

    The historic period, base year, and forecast period can vary slightly depending on the specific market research report. However, for the Asia Pacific Visual Analytics Market report:

  • Historic Period : 2015-2016
  • Base Year : 2017
  • Forecast Period : 2018-2025
  • Who are the major players in Asia Pacific Visual Analytics Market?

    The Asia Pacific Visual Analytics Market is populated by several key players, each contributing to its growth and innovation. Some of the major players include:

  • ALTERYX, INC.
  • IBM CORPORATION
  • Microsoft Corporation
  • MICROSTRATEGY INCORPORATED
  • ORACLE CORPORATION
  • QLIK TECHNOLOGIES INC
  • SAP SE
  • SAS INSTITUTE INC.
  • Tableau Software
  • TIBCO SOFTWARE INC.
  • Who should buy this report?

    The Asia Pacific Visual Analytics Market report is valuable for diverse stakeholders, including:

    • Investors: Provides insights for investment decisions pertaining to market growth, companies, or industry insights. Helps assess market attractiveness and potential returns.
    • Industry Players: Offers competitive intelligence, market sizing, and trend analysis to inform strategic planning, product development, and sales strategies.
    • Suppliers and Manufacturers: Helps understand market demand for components, materials, and services related to concerned industry.
    • Researchers and Consultants: Provides data and analysis for academic research, consulting projects, and market studies.
    • Financial Institutions: Helps assess risks and opportunities associated with financing or investing in the concerned market.

    Essentially, anyone involved in or considering involvement in the Asia Pacific Visual Analytics Market value chain can benefit from the information contained in a comprehensive market report.