توقعات سوق حلول التتبع والتتبع في منطقة آسيا والمحيط الهادئ حتى عام 2030 - التحليل الإقليمي - حسب المكونات (الأجهزة والبرامج)، وحجم المؤسسة (الشركات الصغيرة والمتوسطة والمؤسسات الكبيرة)، والتطبيق (التسلسل والتجميع)، والمستخدمين النهائيين (الأدوية، الأجهزة الطبية، السلع الاستهلاكية، الأغذية والمشروبات وغيرها)

BMIRE00030388 | Pages: 111 | Healthcare IT | Jul 2024 | Type: Regional | Status: Published
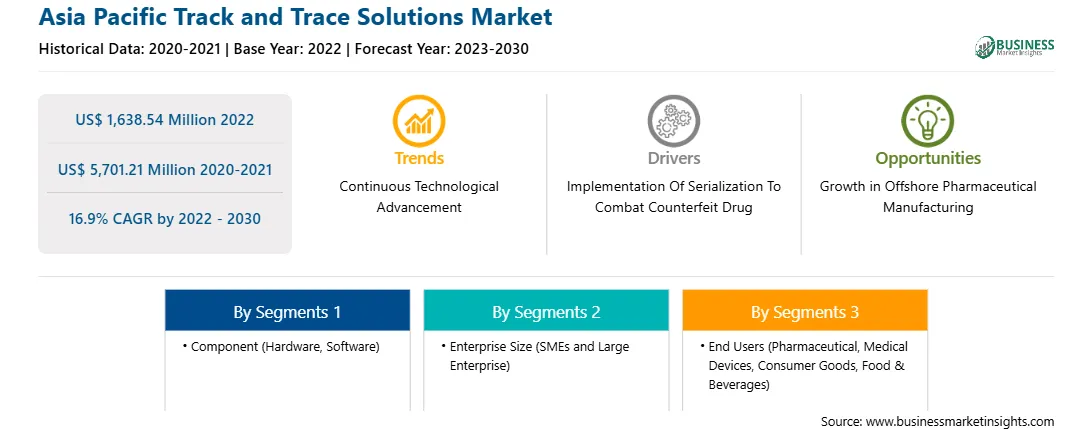
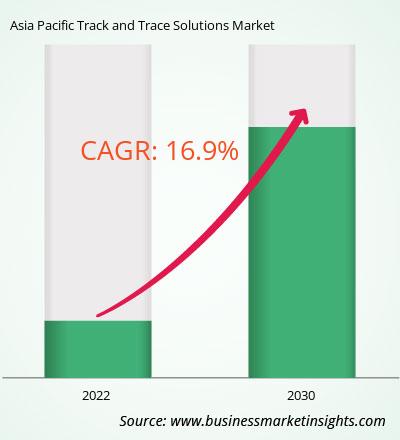
بلغت قيمة سوق حلول المسار والتتبع في منطقة آسيا والمحيط الهادئ 1,638.54 مليون دولار أمريكي في عام 2022 ومن المتوقع أن تصل إلى 5,701.21 مليون دولار أمريكي بحلول عام 2030؛ ومن المقدر أن يسجل معدل نمو سنوي مركب قدره 16.9% من عام 2022 إلى عام 2030.

يعزز النمو في تصنيع الأدوية الخارجية سوق حلول التتبع والتتبع في منطقة آسيا والمحيط الهادئ.

إن عقود التصنيع في الخارج مخصصة لشركات الأدوية الكبيرة التي تتطلع إلى زيادة الإنتاجية والكفاءة في تصنيع الأدوية. تعمل الدول النامية على تطوير مرافقها وخدماتها الصيدلانية بشكل كبير وتتجه نحو التقدم التكنولوجي. ينمو سوق الأدوية في الهند بشكل مستمر، ويحتل مصنعو الأدوية الجنيسة في البلاد مكانة قوية في سلسلة التوريد العالمية.

تلعب هذه الشركات دورًا محوريًا في تطوير الصناعة في الهند. تعد شركات تصنيع الأدوية في الهند واحدة من أكبر مصادر الأدوية الجنيسة على مستوى العالم، حيث توفر 50% من الطلب العالمي على مجموعة من اللقاحات، و40% من سوق الأدوية الجنيسة في الولايات المتحدة، و25% من إجمالي الأدوية في المملكة المتحدة. وفقاً لإدارة الغذاء والدواء الأمريكية، أصبحت الولايات المتحدة، من خلال استثمارها في أبحاث الطب الحيوي، رائدة على مستوى العالم في اكتشاف الأدوية وتطويرها، ولكنها لم تعد في طليعة تصنيع الأدوية. تاريخيًا، كان إنتاج الأدوية لسكان الولايات المتحدة يتم محليًا. ومع ذلك، فقد انتقل تصنيع الأدوية تدريجياً إلى خارج البلاد في العقود الأخيرة. وينطبق هذا بشكل خاص على الشركات المصنعة للمكونات الصيدلانية النشطة (APIs) - الأدوية الفعلية التي يتم تركيبها بعد ذلك في أقراص وكبسولات وحقن وما إلى ذلك. اعتبارًا من أغسطس 2019، قامت 28٪ فقط من منشآت التصنيع بتصنيع واجهات برمجة التطبيقات لتزويد السوق الأمريكية. وعلى النقيض من ذلك، فإن 72% من الشركات المصنعة لواجهة برمجة التطبيقات (API) التي تزود السوق الأمريكية كانت في الخارج، و13% منها كانت في الصين. تمثل الصين حاليًا حوالي 40% من واجهات برمجة التطبيقات المنتجة عالميًا، وتوفر الأسواق الخارجية مثل أوروبا للشركات الصينية إمكانات سوقية إضافية للأدوية الجنيسة وواجهات برمجة التطبيقات بأسعار معقولة. قد تكون الخطة هنا هي تكييف منتج موجود للبيع في الاتحاد الأوروبي، وربما حتى نقل عمليات التصنيع أو تشكيل شراكة مبيعات محلية مع علامة تجارية أوروبية. بالنسبة للعديد من الصناعات، أدى صعود الصين المطرد كقوة اقتصادية عالمية إلى تحولها إلى واحدة من أهم المحركات العالمية للإنتاج والطلب. وحتى التقلبات الاقتصادية الصغيرة في الصين يمكن أن يكون لها آثار مضاعفة يمكن الشعور بها في مختلف القطاعات في جميع أنحاء العالم. تواصل البلاد تحولها الاقتصادي من التركيز على التصنيع الثقيل إلى نموذج يعتمد بشكل أكبر على الخدمات، ويتم إعطاء أولوية عالية بشكل متزايد لتوفير الرعاية الصحية.

يشهد سوق الرعاية الصحية في الصين نموا مزدوج الرقم. ومع ذلك، فإن الإنفاق المنخفض نسبيًا على الرعاية الصحية كنسبة من الناتج المحلي الإجمالي في الصين (الذي يبلغ حوالي 6٪ في الصين مقارنة بنطاق يتراوح بين 10٪ و17٪ في الولايات المتحدة وأوروبا واليابان) يشير إلى أن السوق لا يزال مستعدًا لمزيد من الاستثمار. توسع. أصبحت الرعاية الصحية الصينية أكثر جاذبية للشركات. تعد عمليات التصنيع في الخارج خيارًا جذابًا لتوفير التكلفة. وبالتالي، فإن فرص دخول اللاعبين إلى السوق بمنتجات فعالة من حيث التكلفة أعلى. نظرة عامة على سوق حلول التتبع والتتبع في منطقة آسيا والمحيط الهادئ

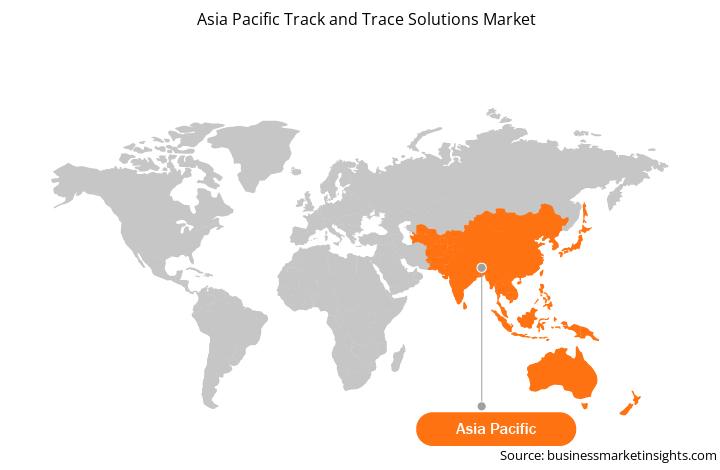
يتم تقسيم سوق حلول التتبع والتتبع في منطقة آسيا والمحيط الهادئ إلى الصين واليابان والهند وكوريا الجنوبية وأستراليا وبقية دول آسيا والمحيط الهادئ. واستحوذت الصين على الحصة الأكبر من السوق في عام 2022، ومن المتوقع أن تظهر الهند وتيرة نمو كبيرة في السوق. يُعزى نمو السوق في هذه البلدان إلى السياسات المواتية المخصصة لحلول التتبع والتتبع للأدوية والأغذية والمشروبات والسلع الاستهلاكية. علاوة على ذلك، تساهم استراتيجيات التوسع وإطلاق المنتجات التي ينفذها اللاعبون في السوق في نمو سوق حلول التتبع والتتبع في المنطقة.

في العديد من الصناعات، تعمل حلول التتبع والتتبع على حل مشكلات إدارة الجودة المتعلقة بالتصنيع وجودة المنتج ورضا العملاء. على سبيل المثال، كان لدى الصين تفويضات تتعلق بمجموعة معقدة من البيانات الرئيسية للمنتج، والبيانات الرئيسية للشركة، وبيانات الإنتاج/التوزيع والبيانات التشغيلية التي يجب جمعها وتنظيمها والإبلاغ عنها. وفقًا للإدارة الصينية للإدارة العامة للرقابة على الجودة، يجب إجراء المراقبة الإلكترونية لجودة المنتجات الطبية من خلال أحكام خاصة، لا سيما من خلال تعزيز الإشراف على سلامة الأغذية وإدارتها من قبل مجلس الدولة.

إيرادات سوق حلول التتبع والتتبع في منطقة آسيا والمحيط الهادئ وتوقعاتها حتى عام 2030 (مليون دولار أمريكي)

تجزئة سوق حلول التتبع والتتبع في منطقة آسيا والمحيط الهادئ

حلول التتبع والتتبع في منطقة آسيا والمحيط الهادئ يتم تصنيف السوق إلى المكونات وحجم المؤسسة والتطبيق والمستخدمين النهائيين والبلد.

استنادًا إلى المكونات، ينقسم سوق حلول التتبع والتتبع في منطقة آسيا والمحيط الهادئ إلى أجهزة وبرامج. استحوذ قطاع البرمجيات على حصة أكبر من سوق حلول التتبع والتتبع في منطقة آسيا والمحيط الهادئ في عام 2022. علاوة على ذلك، تم تصنيف قطاع البرمجيات فرعيًا إلى مدير المصنع، ووحدة التحكم في الخطوط، وغيرها. بالإضافة إلى ذلك، يتم تقسيم قطاع الأجهزة إلى ماسح الباركود وقارئ تحديد الترددات الراديوية (RFID) وغيرها.

من حيث حجم المؤسسة، يتم تقسيم سوق حلول التتبع والتتبع في منطقة آسيا والمحيط الهادئ إلى شركات صغيرة ومتوسطة الحجم ومؤسسات كبيرة. استحوذ قطاع المؤسسات الكبيرة على حصة أكبر من سوق حلول التتبع والتتبع في منطقة آسيا والمحيط الهادئ في عام 2022.

من خلال التطبيق، ينقسم سوق حلول التتبع والتتبع في منطقة آسيا والمحيط الهادئ إلى حلول التسلسل وحلول التجميع. استحوذ قطاع حلول التسلسل على حصة أكبر من سوق حلول التتبع والتتبع في منطقة آسيا والمحيط الهادئ في عام 2022.

فيما يتعلق بالمستخدمين النهائيين، يتم تصنيف سوق حلول التتبع والتتبع في منطقة آسيا والمحيط الهادئ إلى أجهزة صيدلانية وطبية وسلع استهلاكية وغذائية. والمشروبات وغيرها. استحوذ قطاع الأدوية على أكبر حصة سوقية لحلول التتبع والتتبع في منطقة آسيا والمحيط الهادئ في عام 2022.

استنادًا إلى البلد، يتم تصنيف سوق حلول التتبع والتتبع في منطقة آسيا والمحيط الهادئ إلى الصين واليابان والهند وكوريا الجنوبية وأستراليا و بقية دول آسيا والمحيط الهادئ. سيطرت الصين على الحصة السوقية لحلول المسار والتتبع في منطقة آسيا والمحيط الهادئ في عام 2022.

SAP SE، Uhlmann Pac-Systeme GmbH & Co KG، WIPOTEC GmbH، Bar Code India Ltd، Korber AG، Videojet Technologies Inc، Domino Printing Sciences تعد شركة plc وKezzler AS وrfxcel Corp وNeuroTags Inc وJekson Vison Pvt Ltd. من الشركات الرائدة العاملة في سوق حلول التتبع والتتبع في منطقة آسيا والمحيط الهادئ.

TABLE OF CONTENTS


1. Introduction

1.1 The Insight Partners Research Report Guidance

1.2 Market Segmentation

2. Executive Summary

2.1 Key Insights

3. Research Methodology

3.1 Coverage

3.2 Secondary Research

3.3 Primary Research

4. Asia Pacific Track and Trace Solutions Market - Key Market Dynamics

4.1 Asia Pacific Track and Trace Solutions Market - Key Market Dynamics

4.2 Market Drivers

4.2.1 Implementation of Serialization to Combat Counterfeit Drugs

4.2.2 Increasing Number of Packaging-Related Product Recalls

4.3 Market Restraints

4.3.1 High Cost of Products and Implementation

4.4 Market Opportunities

4.4.1 Growth in Offshore Pharmaceutical Manufacturing

4.4.2 Supply Chain Optimization

4.5 Future Trends

4.5.1 Continuous Technological Advancements

4.6 Impact of Drivers and Restraints:

5. Track and Trace Solutions Market - Asia Pacific Market Analysis

5.1 Asia Pacific Track and Trace Solutions Market Revenue (US$ Million), 2020-2030

5.2 Asia Pacific Track and Trace Solutions Market Forecast Analysis

6. Asia Pacific Track and Trace Solutions Market Analysis - by Component

6.1 Software

6.1.1 Overview

6.1.2 Software: Asia Pacific Track and Trace Solutions Market - Revenue and Forecast to 2030 (US$ Million)

6.2 Hardware

6.2.1 Overview

6.2.2 Hardware: Asia Pacific Track and Trace Solutions Market - Revenue and Forecast to 2030 (US$ Million)

7. Asia Pacific Track and Trace Solutions Market Analysis - by Application

7.1 Serialization Solution

7.1.1 Overview

7.1.2 Serialization Solution: Asia Pacific Track and Trace Solutions Market - Revenue and Forecast to 2030 (US$ Million)

7.2 Aggregation Solution

7.2.1 Overview

7.2.2 Aggregation Solution: Asia Pacific Track and Trace Solutions Market - Revenue and Forecast to 2030 (US$ Million)

8. Asia Pacific Track and Trace Solutions Market Analysis - by Enterprises Size

8.1 SMEs

8.1.1 Overview

8.1.2 SMEs: Asia Pacific Track and Trace Solutions Market - Revenue and Forecast to 2030 (US$ Million)

8.2 Large Enterprises

8.2.1 Overview

8.2.2 Large Enterprises: Asia Pacific Track and Trace Solutions Market - Revenue and Forecast to 2030 (US$ Million)

9. Asia Pacific Track and Trace Solutions Market Analysis - by End Users

9.1 Pharmaceutical

9.1.1 Overview

9.1.2 Pharmaceutical: Asia Pacific Track and Trace Solutions Market - Revenue and Forecast to 2030 (US$ Million)

9.2 Medical Devices

9.2.1 Overview

9.2.2 Medical Devices: Asia Pacific Track and Trace Solutions Market - Revenue and Forecast to 2030 (US$ Million)

9.3 Consumer Goods

9.3.1 Overview

9.3.2 Consumer Goods: Asia Pacific Track and Trace Solutions Market - Revenue and Forecast to 2030 (US$ Million)

9.4 Food and Beverages

9.4.1 Overview

9.4.2 Food and Beverages: Asia Pacific Track and Trace Solutions Market - Revenue and Forecast to 2030 (US$ Million)

9.5 Others

9.5.1 Overview

9.5.2 Others: Asia Pacific Track and Trace Solutions Market - Revenue and Forecast to 2030 (US$ Million)

10. Asia Pacific Track and Trace Solutions Market - Country Analysis

10.1 Asia Pacific

10.1.1 Asia Pacific: Track and Trace Solutions Market - Revenue and Forecast Analysis - by Country

10.1.1.1 China: Track and Trace Solutions Market - Revenue and Forecast to 2030 (US$ Million)

10.1.1.1.1 China: Track and Trace Solutions Market Breakdown, by Component

10.1.1.1.1.1 China: Track and Trace Solutions Market Breakdown, by Software

10.1.1.1.1.2 China: Track and Trace Solutions Market Breakdown, by Hardware

10.1.1.1.2 China: Track and Trace Solutions Market Breakdown, by Application

10.1.1.1.3 China: Track and Trace Solutions Market Breakdown, by Enterprises Size

10.1.1.1.4 China: Track and Trace Solutions Market Breakdown, by End Users

10.1.1.2 Japan: Track and Trace Solutions Market - Revenue and Forecast to 2030 (US$ Million)

10.1.1.2.1 Japan: Track and Trace Solutions Market Breakdown, by Component

10.1.1.2.1.1 Japan: Track and Trace Solutions Market Breakdown, by Software

10.1.1.2.1.2 Japan: Track and Trace Solutions Market Breakdown, by Hardware

10.1.1.2.2 Japan: Track and Trace Solutions Market Breakdown, by Application

10.1.1.2.3 Japan: Track and Trace Solutions Market Breakdown, by Enterprises Size

10.1.1.2.4 Japan: Track and Trace Solutions Market Breakdown, by End Users

10.1.1.3 India: Track and Trace Solutions Market - Revenue and Forecast to 2030 (US$ Million)

10.1.1.3.1 India: Track and Trace Solutions Market Breakdown, by Component

10.1.1.3.1.1 India: Track and Trace Solutions Market Breakdown, by Software

10.1.1.3.1.2 India: Track and Trace Solutions Market Breakdown, by Hardware

10.1.1.3.2 India: Track and Trace Solutions Market Breakdown, by Application

10.1.1.3.3 India: Track and Trace Solutions Market Breakdown, by Enterprises Size

10.1.1.3.4 India: Track and Trace Solutions Market Breakdown, by End Users

10.1.1.4 South Korea: Track and Trace Solutions Market - Revenue and Forecast to 2030 (US$ Million)

10.1.1.4.1 South Korea: Track and Trace Solutions Market Breakdown, by Component

10.1.1.4.1.1 South Korea: Track and Trace Solutions Market Breakdown, by Software

10.1.1.4.1.2 South Korea: Track and Trace Solutions Market Breakdown, by Hardware

10.1.1.4.2 South Korea: Track and Trace Solutions Market Breakdown, by Application

10.1.1.4.3 South Korea: Track and Trace Solutions Market Breakdown, by Enterprises Size

10.1.1.4.4 South Korea: Track and Trace Solutions Market Breakdown, by End Users

10.1.1.5 Australia: Track and Trace Solutions Market - Revenue and Forecast to 2030 (US$ Million)

10.1.1.5.1 Australia: Track and Trace Solutions Market Breakdown, by Component

10.1.1.5.1.1 Australia: Track and Trace Solutions Market Breakdown, by Software

10.1.1.5.1.2 Australia: Track and Trace Solutions Market Breakdown, by Hardware

10.1.1.5.2 Australia: Track and Trace Solutions Market Breakdown, by Application

10.1.1.5.3 Australia: Track and Trace Solutions Market Breakdown, by Enterprises Size

10.1.1.5.4 Australia: Track and Trace Solutions Market Breakdown, by End Users

10.1.1.6 Rest of Asia Pacific: Track and Trace Solutions Market - Revenue and Forecast to 2030 (US$ Million)

10.1.1.6.1 Rest of Asia Pacific: Track and Trace Solutions Market Breakdown, by Component

10.1.1.6.1.1 Rest of Asia Pacific: Track and Trace Solutions Market Breakdown, by Software

10.1.1.6.1.2 Rest of Asia Pacific: Track and Trace Solutions Market Breakdown, by Hardware

10.1.1.6.2 Rest of Asia Pacific: Track and Trace Solutions Market Breakdown, by Application

10.1.1.6.3 Rest of Asia Pacific: Track and Trace Solutions Market Breakdown, by Enterprises Size

10.1.1.6.4 Rest of Asia Pacific: Track and Trace Solutions Market Breakdown, by End Users

11. Industry Landscape

11.1 Overview

11.2 Growth Strategies Done by the Companies in the Market, (%)

11.3 Organic Developments

11.3.1 Overview

11.4 Inorganic Developments

11.4.1 Overview

12. Company Profiles

12.1 SAP SE

12.1.1 Key Facts

12.1.2 Business Description

12.1.3 Products and Services

12.1.4 Financial Overview

12.1.5 SWOT Analysis

12.1.6 Key Developments

12.2 Uhlmann Pac-Systeme GmbH & Co KG

12.2.1 Key Facts

12.2.2 Business Description

12.2.3 Products and Services

12.2.4 Financial Overview

12.2.5 SWOT Analysis

12.2.6 Key Developments

12.3 WIPOTEC GmbH

12.3.1 Key Facts

12.3.2 Business Description

12.3.3 Products and Services

12.3.4 Financial Overview

12.3.5 SWOT Analysis

12.3.6 Key Developments

12.4 Bar Code India Ltd

12.4.1 Key Facts

12.4.2 Business Description

12.4.3 Products and Services

12.4.4 Financial Overview

12.4.5 SWOT Analysis

12.4.6 Key Developments

12.5 Korber AG

12.5.1 Key Facts

12.5.2 Business Description

12.5.3 Products and Services

12.5.4 Financial Overview

12.5.5 SWOT Analysis

12.5.6 Key Developments

12.6 Videojet Technologies Inc

12.6.1 Key Facts

12.6.2 Business Description

12.6.3 Products and Services

12.6.4 Financial Overview

12.6.5 SWOT Analysis

12.6.6 Key Developments

12.7 Domino Printing Sciences plc

12.7.1 Key Facts

12.7.2 Business Description

12.7.3 Products and Services

12.7.4 Financial Overview

12.7.5 SWOT Analysis

12.7.6 Key Developments

12.8 Kezzler AS

12.8.1 Key Facts

12.8.2 Business Description

12.8.3 Products and Services

12.8.4 Financial Overview

12.8.5 SWOT Analysis

12.8.6 Key Developments

12.9 rfxcel Corp

12.9.1 Key Facts

12.9.2 Business Description

12.9.3 Products and Services

12.9.4 Financial Overview

12.9.5 SWOT Analysis

12.9.6 Key Developments

12.10 NeuroTags Inc

12.10.1 Key Facts

12.10.2 Business Description

12.10.3 Products and Services

12.10.4 Financial Overview

12.10.5 SWOT Analysis

12.10.6 Key Developments

12.11 Jekson Vison Pvt Ltd

12.11.1 Key Facts

12.11.2 Business Description

12.11.3 Products and Services

12.11.4 Financial Overview

12.11.5 SWOT Analysis

12.11.6 Key Developments

13. Appendix

13.1 About Us

13.2 Glossary of Terms

List of Tables

Table 1. Asia Pacific Track and Trace Solutions Market Segmentation

Table 2. Asia Pacific Track and Trace Solutions Market - Revenue and Forecast to 2030 (US$ Million)

Table 3. Asia Pacific Track and Trace Solutions Market - Revenue and Forecast to 2030 (US$ Million) - by Component

Table 4. Asia Pacific Track and Trace Solutions Market - Revenue and Forecast to 2030 (US$ Million) - by Software

Table 5. Asia Pacific Track and Trace Solutions Market - Revenue and Forecast to 2030 (US$ Million) - by Hardware

Table 6. Asia Pacific Track and Trace Solutions Market - Revenue and Forecast to 2030 (US$ Million) - by Application

Table 7. Asia Pacific Track and Trace Solutions Market - Revenue and Forecast to 2030 (US$ Million) - by Enterprises Size

Table 8. Asia Pacific Track and Trace Solutions Market - Revenue and Forecast to 2030 (US$ Million) - by End Users

Table 9. China: Track and Trace Solutions Market - Revenue and Forecast to 2030(US$ Million) - by Component

Table 10. China: Track and Trace Solutions Market - Revenue and Forecast to 2030(US$ Million) - by Software

Table 11. China: Track and Trace Solutions Market - Revenue and Forecast to 2030(US$ Million) - by Hardware

Table 12. China: Track and Trace Solutions Market - Revenue and Forecast to 2030(US$ Million) - by Application

Table 13. China: Track and Trace Solutions Market - Revenue and Forecast to 2030(US$ Million) - by Enterprises Size

Table 14. China: Track and Trace Solutions Market - Revenue and Forecast to 2030(US$ Million) - by End Users

Table 15. Japan: Track and Trace Solutions Market - Revenue and Forecast to 2030(US$ Million) - by Component

Table 16. Japan: Track and Trace Solutions Market - Revenue and Forecast to 2030(US$ Million) - by Software

Table 17. Japan: Track and Trace Solutions Market - Revenue and Forecast to 2030(US$ Million) - by Hardware

Table 18. Japan: Track and Trace Solutions Market - Revenue and Forecast to 2030(US$ Million) - by Application

Table 19. Japan: Track and Trace Solutions Market - Revenue and Forecast to 2030(US$ Million) - by Enterprises Size

Table 20. Japan: Track and Trace Solutions Market - Revenue and Forecast to 2030(US$ Million) - by End Users

Table 21. India: Track and Trace Solutions Market - Revenue and Forecast to 2030(US$ Million) - by Component

Table 22. India: Track and Trace Solutions Market - Revenue and Forecast to 2030(US$ Million) - by Software

Table 23. India: Track and Trace Solutions Market - Revenue and Forecast to 2030(US$ Million) - by Hardware

Table 24. India: Track and Trace Solutions Market - Revenue and Forecast to 2030(US$ Million) - by Application

Table 25. India: Track and Trace Solutions Market - Revenue and Forecast to 2030(US$ Million) - by Enterprises Size

Table 26. India: Track and Trace Solutions Market - Revenue and Forecast to 2030(US$ Million) - by End Users

Table 27. South Korea: Track and Trace Solutions Market - Revenue and Forecast to 2030(US$ Million) - by Component

Table 28. South Korea: Track and Trace Solutions Market - Revenue and Forecast to 2030(US$ Million) - by Software

Table 29. South Korea: Track and Trace Solutions Market - Revenue and Forecast to 2030(US$ Million) - by Hardware

Table 30. South Korea: Track and Trace Solutions Market - Revenue and Forecast to 2030(US$ Million) - by Application

Table 31. South Korea: Track and Trace Solutions Market - Revenue and Forecast to 2030(US$ Million) - by Enterprises Size

Table 32. South Korea: Track and Trace Solutions Market - Revenue and Forecast to 2030(US$ Million) - by End Users

Table 33. Australia: Track and Trace Solutions Market - Revenue and Forecast to 2030(US$ Million) - by Component

Table 34. Australia: Track and Trace Solutions Market - Revenue and Forecast to 2030(US$ Million) - by Software

Table 35. Australia: Track and Trace Solutions Market - Revenue and Forecast to 2030(US$ Million) - by Hardware

Table 36. Australia: Track and Trace Solutions Market - Revenue and Forecast to 2030(US$ Million) - by Application

Table 37. Australia: Track and Trace Solutions Market - Revenue and Forecast to 2030(US$ Million) - by Enterprises Size

Table 38. Australia: Track and Trace Solutions Market - Revenue and Forecast to 2030(US$ Million) - by End Users

Table 39. Rest of Asia Pacific: Track and Trace Solutions Market - Revenue and Forecast to 2030(US$ Million) - by Component

Table 40. Rest of Asia Pacific: Track and Trace Solutions Market - Revenue and Forecast to 2030(US$ Million) - by Software

Table 41. Rest of Asia Pacific: Track and Trace Solutions Market - Revenue and Forecast to 2030(US$ Million) - by Hardware

Table 42. Rest of Asia Pacific: Track and Trace Solutions Market - Revenue and Forecast to 2030(US$ Million) - by Application

Table 43. Rest of Asia Pacific: Track and Trace Solutions Market - Revenue and Forecast to 2030(US$ Million) - by Enterprises Size

Table 44. Rest of Asia Pacific: Track and Trace Solutions Market - Revenue and Forecast to 2030(US$ Million) - by End Users

Table 45. Organic Developments Done by Companies

Table 46. Inorganic Developments Done by Companies

Table 47. Glossary of Terms, Track and Trace Market

List of Figures

Figure 1. Asia Pacific Track and Trace Solutions Market Segmentation, by Country

Figure 2. Impact Analysis of Drivers and Restraints

Figure 3. Asia Pacific Track and Trace Solutions Market Revenue (US$ Million), 2020-2030

Figure 4. Asia Pacific Track and Trace Solutions Market Share (%) - by Component (2022 and 2030)

Figure 5. Software: Asia Pacific Track and Trace Solutions Market - Revenue and Forecast to 2030 (US$ Million)

Figure 6. Hardware: Asia Pacific Track and Trace Solutions Market - Revenue and Forecast to 2030 (US$ Million)

Figure 7. Asia Pacific Track and Trace Solutions Market Share (%) - by Application (2022 and 2030)

Figure 8. Serialization Solution: Asia Pacific Track and Trace Solutions Market - Revenue and Forecast to 2030 (US$ Million)

Figure 9. Aggregation Solution: Asia Pacific Track and Trace Solutions Market - Revenue and Forecast to 2030 (US$ Million)

Figure 10. Asia Pacific Track and Trace Solutions Market Share (%) - by Enterprises Size (2022 and 2030)

Figure 11. SMEs: Asia Pacific Track and Trace Solutions Market - Revenue and Forecast to 2030 (US$ Million)

Figure 12. Large Enterprises: Asia Pacific Track and Trace Solutions Market - Revenue and Forecast to 2030 (US$ Million)

Figure 13. Asia Pacific Track and Trace Solutions Market Share (%) - by End Users (2022 and 2030)

Figure 14. Pharmaceutical: Asia Pacific Track and Trace Solutions Market - Revenue and Forecast to 2030 (US$ Million)

Figure 15. Medical Devices: Asia Pacific Track and Trace Solutions Market - Revenue and Forecast to 2030 (US$ Million)

Figure 16. Consumer Goods: Asia Pacific Track and Trace Solutions Market - Revenue and Forecast to 2030 (US$ Million)

Figure 17. Food and Beverages: Asia Pacific Track and Trace Solutions Market - Revenue and Forecast to 2030 (US$ Million)

Figure 18. Others: Asia Pacific Track and Trace Solutions Market - Revenue and Forecast to 2030 (US$ Million)

Figure 19. Asia Pacific: Track and Trace Solutions Market Revenue, by Key Countries, (2022) (US$ Mn)

Figure 20. Asia Pacific: Track and Trace Solutions Market Breakdown, by Key Countries, 2022 and 2030 (%)

Figure 21. China: Track and Trace Solutions Market - Revenue and Forecast to 2030(US$ Million)

Figure 22. Japan: Track and Trace Solutions Market - Revenue and Forecast to 2030(US$ Million)

Figure 23. India: Track and Trace Solutions Market - Revenue and Forecast to 2030(US$ Million)

Figure 24. South Korea: Track and Trace Solutions Market - Revenue and Forecast to 2030(US$ Million)

Figure 25. Australia: Track and Trace Solutions Market - Revenue and Forecast to 2030(US$ Million)

Figure 26. Rest of Asia Pacific: Track and Trace Solutions Market - Revenue and Forecast to 2030(US$ Million)

Figure 27. Growth Strategies Done by the Companies in the Market, (%)

1. SAP SE 
2. Uhlmann Pac-Systeme GmbH & Co KG 
3. WIPOTEC GmbH 
4. Bar Code India Ltd 
5. Korber AG 
6. Videojet Technologies Inc 
7. Domino Printing Sciences plc 
8. Kezzler AS 
9. rfxcel Corp 
10. NeuroTags Inc 
11. Jekson Vison Pvt Ltd 

  • Save and reduce time carrying out entry-level research by identifying the growth, size, leading players, and segments in the Asia Pacific track and trace solutions market.
  • Highlights key business priorities in order to assist companies to realign their business strategies.
  • The key findings and recommendations highlight crucial progressive industry trends in the Asia Pacific track and trace solutions market, thereby allowing players across the value chain to develop effective long-term strategies.
  • Develop/modify business expansion plans by using substantial growth offering developed and emerging markets.
  • Scrutinize in-depth Asia Pacific market trends and outlook coupled with the factors driving the Asia Pacific track and trace solutions market, as well as those hindering it.
  • Enhance the decision-making process by understanding the strategies that underpin commercial interest with respect to client products, segmentation, pricing, and distribution.
Report Code
Full Name
Country Name
Email Id
Phone Number
Job Title
Company
Requirement

Note : Your data will never be shared with third parties, however, we may send you information from time to time about our products that may be of interest to you. By submitting your details, you agree to be contacted by us. You may contact us at any time to opt-out.


Purchase Options
Single User License
$3550
$2840
Site License
$4550
$3640
Enterprise License
$5550
$4440