توقعات سوق حبيبات الوجبات الخفيفة في منطقة آسيا والمحيط الهادئ حتى عام 2030 - تحليل إقليمي - حسب المصدر (البطاطس والذرة والأرز والتابيوكا والحبوب المتعددة وغيرها)، والنوع (عادي ومنكه)، والشكل (مغلف، وجه القالب، ثلاثي الأبعاد، وغيرها)
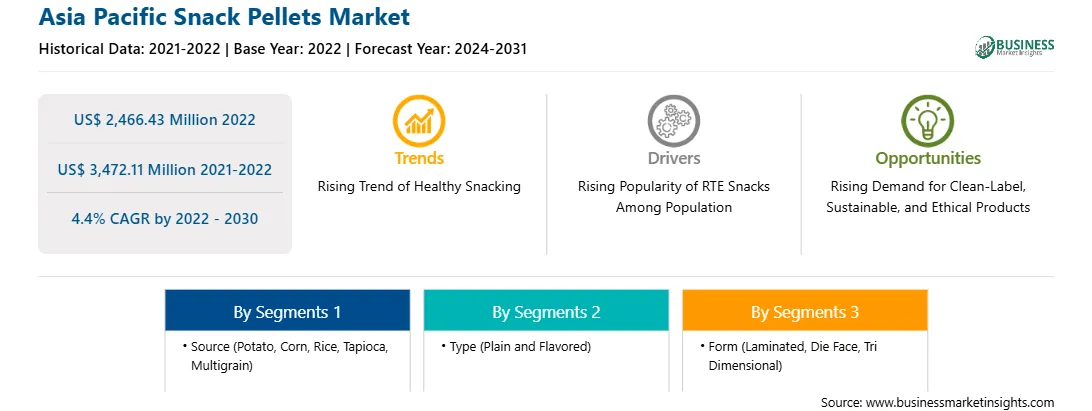
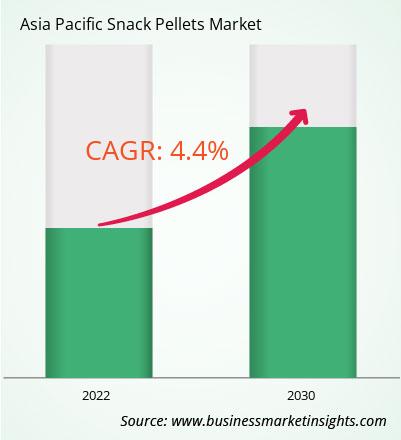
بلغت قيمة سوق حبيبات الوجبات الخفيفة في منطقة آسيا والمحيط الهادئ 2,466.43 مليون دولار أمريكي في عام 2022 ومن المتوقع أن تصل إلى 3,472.11 مليون دولار أمريكي بحلول عام 2030؛ ومن المتوقع أن تسجل معدل نمو سنوي مركب بنسبة 4.4٪ من عام 2022 إلى عام 2030.
الطلب المتزايد على المنتجات النظيفة والمستدامة والأخلاقية يدفع سوق حبيبات الوجبات الخفيفة في منطقة آسيا والمحيط الهادئ
على مدى السنوات القليلة الماضية، ركز المستهلكون بشكل متزايد على الاستدامة. لقد نما تفضيل المنتجات الأكثر نظافة والمصدر الأخلاقي والصديقة للبيئة بشكل كبير. أدى نمط الحياة الثابت والضغوط المرتبطة بالعمل إلى مشاكل صحية متعددة. لذلك، يركز المستهلكون على الأكل النظيف. أيضًا، في أعقاب الوباء، يختار المستهلكون بدائل مستدامة. وبالتالي، أثرت تفضيلات المستهلكين المتغيرة أيضًا على سلوك الشراء لديهم.
يركز مصنعو حبيبات الوجبات الخفيفة على تطوير منتجات مبتكرة بمكونات نظيفة وطبيعية وعضوية وخالية من الكائنات المعدلة وراثيًا (GMO) والتي يتم الحصول عليها بطريقة أخلاقية. يركز المستهلكون أيضًا على صحة المزارعين والعمال عبر سلسلة التوريد ويفضلون المنتجات ذات الملصقات الشفافة. لذلك، يركز مصنعو حبيبات الوجبات الخفيفة على شراء المواد الخام المعتمدة من قبل وكالات مثل التجارة العادلة. تضمن المواد الخام المعتمدة من التجارة العادلة حصول المزارعين والعمال على تعويضات ومعاملة عادلة. وبالتالي، من المتوقع أن يفتح الطلب المتزايد على منتجات الوجبات الخفيفة النظيفة والأخلاقية والمستدامة فرصًا محتملة في سوق حبيبات الوجبات الخفيفة في منطقة آسيا والمحيط الهادئ على مدار السنوات القادمة.
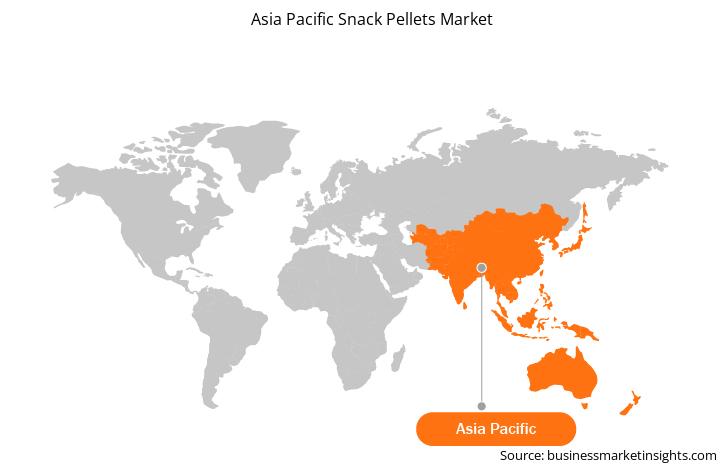
نظرة عامة على سوق حبيبات الوجبات الخفيفة في منطقة آسيا والمحيط الهادئ
يتم تقسيم سوق حبيبات الوجبات الخفيفة في بقية منطقة آسيا والمحيط الهادئ إلى سنغافورة وإندونيسيا وتايلاند وماليزيا ونيوزيلندا، من بين دول أخرى. ومن المتوقع أن يُظهر السوق في هذه البلدان نموًا كبيرًا في السنوات القادمة بسبب زيادة دخل الفرد وارتفاع عدد السكان. علاوة على ذلك، من المتوقع أيضًا أن يؤدي الطلب المتزايد على الأطعمة الجاهزة بسبب زيادة القدرة الشرائية للمستهلكين إلى تعزيز نمو السوق في بقية منطقة آسيا والمحيط الهادئ.
إيرادات سوق حبيبات الوجبات الخفيفة في منطقة آسيا والمحيط الهادئ وتوقعاتها حتى عام 2030 (مليون دولار أمريكي)
تقسيم سوق حبيبات الوجبات الخفيفة في منطقة آسيا والمحيط الهادئ
يتم تصنيف سوق حبيبات الوجبات الخفيفة في منطقة آسيا والمحيط الهادئ إلى مصدر ونوع وشكل وبلد.
حسب المصدر، يتم تقسيم سوق حبيبات الوجبات الخفيفة في منطقة آسيا والمحيط الهادئ إلى البطاطس والذرة والأرز والتابيوكا والحبوب المتعددة وغيرها. احتل قطاع البطاطس أكبر حصة في سوق حبيبات الوجبات الخفيفة في منطقة آسيا والمحيط الهادئ في عام 2022.
من حيث النوع، يتم تقسيم سوق حبيبات الوجبات الخفيفة في منطقة آسيا والمحيط الهادئ إلى عادي ومنكهة. احتل القطاع العادي حصة أكبر من حصة سوق حبيبات الوجبات الخفيفة في منطقة آسيا والمحيط الهادئ في عام 2022.
بناءً على الشكل، يتم تقسيم سوق حبيبات الوجبات الخفيفة في منطقة آسيا والمحيط الهادئ إلى رقائق، ووجه القالب، وثلاثي الأبعاد، وغيرها. احتل القطاع الرقائقي الحصة الأكبر من حصة سوق حبيبات الوجبات الخفيفة في منطقة آسيا والمحيط الهادئ في عام 2022.
بناءً على البلد، يتم تقسيم سوق حبيبات الوجبات الخفيفة في منطقة آسيا والمحيط الهادئ إلى الصين واليابان والهند وأستراليا وكوريا الجنوبية وبقية منطقة آسيا والمحيط الهادئ. احتل قطاع بقية منطقة آسيا والمحيط الهادئ الحصة الأكبر من سوق حبيبات الوجبات الخفيفة في منطقة آسيا والمحيط الهادئ في عام 2022.
تعد Bach Snacks SAL و LENG-D\'OR SAU و Mafin SRL و Noble Agro Food Products Pvt Ltd و Societe Cooperative Agricole Limagrain من بين الشركات الرائدة العاملة في سوق حبيبات الوجبات الخفيفة في منطقة آسيا والمحيط الهادئ.
Asia Pacific Snack Pellets Strategic Insights
Strategic insights for Asia Pacific Snack Pellets involve closely monitoring industry trends, consumer behaviours, and competitor actions to identify opportunities for growth. By leveraging data analytics, businesses can anticipate market shifts and make informed decisions that align with evolving customer needs. Understanding these dynamics helps companies adjust their strategies proactively, enhance customer engagement, and strengthen their competitive edge. Building strong relationships with stakeholders and staying agile in response to changes ensures long-term success in any market.
الصين والهند واليابان وأستراليا وبقية دول آسيا والمحيط الهادئ
Market leaders and key company profiles
Bach Snacks SAL
LENG-DOR SAU
Mafin SRL
Noble Agro Food Products Pvt Ltd
Societe Cooperative Agricole Limagrain
Get more information on this report
Asia Pacific Snack Pellets Regional Insights
The regional scope of Asia Pacific Snack Pellets refers to the geographical area in which a business operates and competes. Understanding regional nuances, such as local consumer preferences, economic conditions, and regulatory environments, is crucial for tailoring strategies to specific markets. Businesses can expand their reach by identifying underserved regions or adapting their offerings to meet regional demands. A clear regional focus allows for more effective resource allocation, targeted marketing, and better positioning against local competitors, ultimately driving growth in those specific areas.
Get more information on this report
Identical Market Reports with other Region/Countries
The List of Companies - Asia Pacific Snack Pellets Market
Bach Snacks SAL
LENG-D'OR SAU
Mafin SRL
Noble Agro Food Products Pvt Ltd
Societe Cooperative Agricole Limagrain
Frequently Asked Questions
How big is the Asia Pacific Snack Pellets Market?
The Asia Pacific Snack Pellets Market is valued at US$ 2,466.43 Million in 2022, it is projected to reach US$ 3,472.11 Million by 2030.
What is the CAGR for Asia Pacific Snack Pellets Market by (2022 - 2030)?
As per our report Asia Pacific Snack Pellets Market, the market size is valued at US$ 2,466.43 Million in 2022, projecting it to reach US$ 3,472.11 Million by 2030. This translates to a CAGR of approximately 4.4% during the forecast period.
What segments are covered in this report?
The Asia Pacific Snack Pellets Market report typically cover these key segments-
المصدر (البطاطس، الذرة، الأرز، التابيوكا، الحبوب المتعددة)
النوع (عادي ومنكه)
الشكل (مغلف، وجه القالب، ثلاثي الأبعاد)
What is the historic period, base year, and forecast period taken for Asia Pacific Snack Pellets Market?
The historic period, base year, and forecast period can vary slightly depending on the specific market research report. However, for the Asia Pacific Snack Pellets Market report:
Historic Period : 2020-2021
Base Year : 2022
Forecast Period : 2023-2030
Who are the major players in Asia Pacific Snack Pellets Market?
The Asia Pacific Snack Pellets Market is populated by several key players, each contributing to its growth and innovation. Some of the major players include:
Bach Snacks SAL
LENG-DOR SAU
Mafin SRL
Noble Agro Food Products Pvt Ltd
Societe Cooperative Agricole Limagrain
Who should buy this report?
The Asia Pacific Snack Pellets Market report is valuable for diverse stakeholders, including:
Investors: Provides insights for investment decisions pertaining to market growth, companies, or industry insights. Helps assess market attractiveness and potential returns.
Industry Players: Offers competitive intelligence, market sizing, and trend analysis to inform strategic planning, product development, and sales strategies.
Suppliers and Manufacturers: Helps understand market demand for components, materials, and services related to concerned industry.
Researchers and Consultants: Provides data and analysis for academic research, consulting projects, and market studies.
Financial Institutions: Helps assess risks and opportunities associated with financing or investing in the concerned market.
Essentially, anyone involved in or considering involvement in the Asia Pacific Snack Pellets Market value chain can benefit from the information contained in a comprehensive market report.
Get Free Sample For Asia Pacific Snack Pellets Market
1. Complete the form
2. Check your inbox (and spam/junk folder)
3. Your Personal Data is Secure with us
GDPR + CCPA Compliant
Personal & transactional information is kept safe from unauthorized use.
WHAT'S INCLUDED IN FULL REPORT : Market Dynamics,
Competitive Analysis and Assessment, Define Business Strategies, Market Outlook and
Trends, Market Size and Share Analysis, Growth Driving Factors, Future Commercial
Potential, Identify Regional Growth Engines


 Get Free Sample For Asia Pacific Snack Pellets Market

