Analysis – by Component (Hardware, Software, and Services), Payment System (Open Payment System, Smart Card, and NFC), and End User (Transportation, Sport and Entertainment, Parking, and Others)
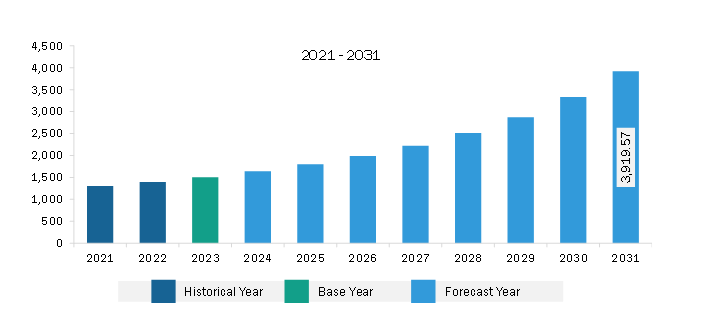
The Asia Pacific smart ticketing market was valued at US$ 1,508.01 million in 2023 and is expected to reach US$ 3,919.57 million by 2031; it is estimated to record a CAGR of 12.7% from 2023 to 2031.
Rising Investments in Smart Stadiums Boost Asia Pacific Smart Ticketing Market
In recent years, the global need for contactless experience systems has accelerated the use of smart ticketing in stadium and event sales processes. Smart ticketing provides an easy way for stadium and event organizers to run their operations more efficiently, avoiding overhead costs and procedural bottlenecks. This is crucial since traditional paper-based ticketing needs more labor and resources, rendering it an unsustainable method of organizing sporting events. The implementation of a smart ticketing system can dramatically enhance ticket sales by allowing fans to check the availability of their favorite seats and order tickets that match their preferences. The significant data acquired from these bookings allows organizers to determine which areas fans are most interested in, resulting in the development of targeted ticketing strategies that appeal to specific audience segments. With smart ticketing taking care of ticket validation, the stadium staff may be reallocated to improve fan experiences, assist with crowd management, provide information and guidance, or support key areas that require human intervention. Smart ticketing makes the best use of workers by streamlining ticketing operations, boosting both operational efficiency and the entire stadium experience for attendees. For instance, RFID tickets were utilized by millions of supporters during the FIFA Confederations Cup in 2013, the FIFA World Cup in 2014, the FIFA Confederations Cup in 2017, the FIFA World Cup in 2018, the FIFA Arab Cup in 2021, and the FIFA World Cup 2022 in Qatar. FIFA had appointed HID as its official ticket producer. Thus, increasing investments in smart stadiums to make the user payment experience seamless is expected to create lucrative opportunities for the smart ticketing market expansion.
Asia Pacific Smart Ticketing Market Overview
The APAC smart ticketing market is witnessing significant growth, attributed to the increasing adoption of advanced technologies to provide convenience across various sectors in highly populated countries. The market is expected to benefit from the growing regional digitization. For example, in April 2023, China's launch of a unified mobile application integrating various ticket-selling platforms from over 140 nations is a notable development in this space. This initiative reflects the region's increasing focus on smart ticketing solutions to enhance the efficiency of transit systems and cater to the needs of a large population. According to the China Academy of Railway Sciences Company, the system, created specifically for the nations taking part in China's Belt and Road Initiative, would link and coordinate their platforms for selling tickets.
Moreover, the smart ticketing market growth is largely attributed to the increasing preference for contactless payments. This shift in consumer behavior has become a significant driving factor for the smart ticketing industry, as businesses across various sectors seek to capitalize on the convenience and security offered by contactless payment solutions.
Asia Pacific Smart Ticketing Market Revenue and Forecast to 2031 (US$ Million)
Based on component, the Asia Pacific smart ticketing market is segmented into hardware, software, and services. The hardware segment held the largest market share in 2023.
By payment system, the Asia Pacific smart ticketing market is segmented into open payment system, smart card, and NFC. The smart card segment held the largest market share in 2023.
Based on end user, the Asia Pacific smart ticketing market is segmented into transportation, sport and entertainment, parking, and others. The transportation segment held the largest market share in 2023.
By country, the Asia Pacific smart ticketing market is segmented into India, China, Japan, South Korea, Australia, and the Rest of Asia Pacific. China dominated the Asia Pacific smart ticketing market share in 2023.
Infineon Technologies AG, NXP Semiconductors NV, Xerox Holdings Corp, Cubic Corp, IDEMIA France SAS, Thales SA, Confidex, HID Global Corp, and Siemens Energy AG are some of the leading companies operating in the Asia Pacific smart ticketing market.
Asia Pacific Smart Ticketing Market Strategic Insights
Get more information on this report
Asia Pacific Smart Ticketing Market Segmentation Analysis
Asia Pacific Smart Ticketing Market Report Highlights
Asia Pacific Smart Ticketing Report Scope
Report Attribute
Details
Market size in 2023
US$ 1,508.01 Million
Market Size by 2031
US$ 3,919.57 Million
CAGR (2023 - 2031)
12.7%
Historical Data
2021-2022
Forecast period
2024-2031
Segments Covered
By Component
Hardware
Software
Services
By Payment System
Open Payment System
Smart Card
NFC
By End User
Transportation
Sport and Entertainment
Parking
Regions and Countries Covered
Asia-Pacific
China, India, Japan, Australia, Rest of Asia-Pacific
Market leaders and key company profiles
Infineon Technologies AG.
NXP Semiconductors NV.
Xerox Holdings Corp.
Cubic Corp.
IDEMIA France SAS.
Thales SA.
Confidex.
HID Global Corp.
Siemens Energy AG.
Get more information on this report
Asia Pacific Smart Ticketing Market Country and Regional Insights
Get more information on this report
Identical Market Reports with other Region/Countries
The List of Companies - Asia Pacific Smart Ticketing Market
Infineon Technologies AG.NXP Semiconductors NV.Xerox Holdings Corp.Cubic Corp.IDEMIA France SAS.Thales SA.Confidex.HID Global Corp.Siemens Energy AG.
About Author— Electronics and Semiconductor Research Team
Siddhika is an experienced market research professional with over five years of expertise in delivering actionable market intelligence and strategic insights to support business growth and decision-making. She has strong experience in designing and managing end-to-end research engagements, including research planning, data collection, and insight generation.
Proficient in research methodologies, Siddhika synthesizes diverse information sources to deliver accurate, high-quality insights and strategic recommendations. She excels at translating complex market information into strategic narratives that support executive decision-making..
Show More
Frequently Asked Questions
How big is the Asia Pacific Smart Ticketing Market?
The Asia Pacific Smart Ticketing Market is valued at US$ 1,508.01 Million in 2023, it is projected to reach US$ 3,919.57 Million by 2031.
What is the CAGR for Asia Pacific Smart Ticketing Market by (2023 - 2031)?
As per our report Asia Pacific Smart Ticketing Market, the market size is valued at US$ 1,508.01 Million in 2023, projecting it to reach US$ 3,919.57 Million by 2031. This translates to a CAGR of approximately 12.7% during the forecast period.
What segments are covered in this report?
The Asia Pacific Smart Ticketing Market report typically cover these key segments-
Component (Hardware, Software, Services)
Payment System (Open Payment System, Smart Card, NFC)
End User (Transportation, Sport and Entertainment, Parking)
What is the historic period, base year, and forecast period taken for Asia Pacific Smart Ticketing Market?
The historic period, base year, and forecast period can vary slightly depending on the specific market research report. However, for the Asia Pacific Smart Ticketing Market report:
Historic Period : 2021-2022
Base Year : 2023
Forecast Period : 2024-2031
Who are the major players in Asia Pacific Smart Ticketing Market?
The Asia Pacific Smart Ticketing Market is populated by several key players, each contributing to its growth and innovation. Some of the major players include:
Infineon Technologies AG.
NXP Semiconductors NV.
Xerox Holdings Corp.
Cubic Corp.
IDEMIA France SAS.
Thales SA.
Confidex.
HID Global Corp.
Siemens Energy AG.
Who should buy this report?
The Asia Pacific Smart Ticketing Market report is valuable for diverse stakeholders, including:
Investors: Provides insights for investment decisions pertaining to market growth, companies, or industry insights. Helps assess market attractiveness and potential returns.
Industry Players: Offers competitive intelligence, market sizing, and trend analysis to inform strategic planning, product development, and sales strategies.
Suppliers and Manufacturers: Helps understand market demand for components, materials, and services related to concerned industry.
Researchers and Consultants: Provides data and analysis for academic research, consulting projects, and market studies.
Financial Institutions: Helps assess risks and opportunities associated with financing or investing in the concerned market.
Essentially, anyone involved in or considering involvement in the Asia Pacific Smart Ticketing Market value chain can benefit from the information contained in a comprehensive market report.


 Get Free Sample For Asia Pacific Smart Ticketing Market


