Analysis – by Type (Pressure Sensor, Temperature Sensor, Flow Sensor, and Level Sensor), Connectivity (Wired and Wireless), Function (Remote Monitoring, Condition Monitoring and Maintenance, Analysis and Simulation, and Others), and Application (Upstream, Midstream, and Downstream)
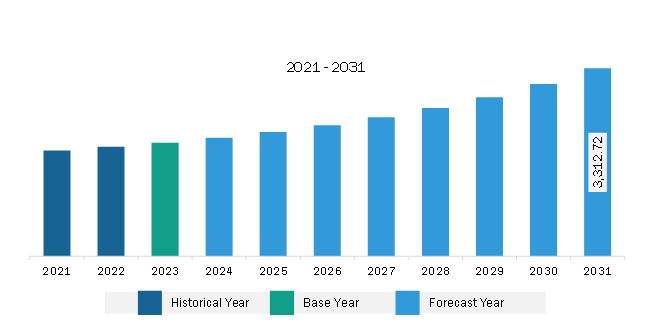
The Asia Pacific oil & gas sensors market was valued at US$ 2,001.22 million in 2023 and is expected to reach US$ 3,312.72 million by 2031; it is estimated to register a CAGR of 6.5% from 2023 to 2031.
Increasing Adoption of Wireless Sensors and Miniaturized Sensors Boosts Asia Pacific Oil & Gas Sensors Market
The oil & gas industry is constantly seeking ways to improve efficiency, increase safety, and optimize operations. This has led to a greater focus on technological innovation, particularly in the field of sensor technology; for example, the development of wireless sensors. These sensors eliminate the need for complex and expensive wiring systems, enabling easy installation and flexibility in monitoring various parameters in the oil & gas infrastructure. Wireless sensors offer real-time data collection, reducing downtime and enhancing decision-making capabilities. They also provide remote monitoring and control capabilities to operators by improving overall operational efficiency. The growing demand for automated monitoring sensors encourages market players to develop new innovative sensors used in the oil & gas industry. For instance, in November 2023, SKF AB expanded its portfolio by launching a new wireless sensor that supports the oil & gas industry to automate machine monitoring in hazardous areas.
Miniaturized sensors, another technological advancement in sensor technology, are smaller in size yet retain high-performance capabilities. These sensors are designed to withstand harsh operating conditions, including high temperatures and extreme pressures, making them ideal for use in oil & gas exploration and production activities. The compact size of miniaturized sensors allows for easy integration into existing infrastructure, reducing installation costs and minimizing disruption to operations. For instance, WIKA Alexander Wiegand SE & Co. KG provides a miniature pressure sensor that offers high measurement performance in extreme pressure spikes. Thus, the increasing adoption of wireless sensors and miniaturized sensors is expected to create lucrative opportunities for the oil & gas sensors market growth during the forecast period.
Asia Pacific Oil & Gas Sensors Market Overview
The APAC temperature sensors market is anticipated to expand at a notable pace during the forecast period owing to the growing consumption of crude oil, biofuels, and other petroleum liquids. According to data by the US Energy Information Administration, in 2022, China and India recorded an oil consumption of 15.15 and 5.05 million barrels per day, respectively, accounting for 15% and 5% of the world’s total oil consumption. Companies in China and India are highly demanding crude oil converting electricity and other renewables, which encourages oil & gas market players to increase their production capacity. Moreover, the growing need for oil & gas plant capacity expansion is likely to propel the adoption of temperature sensors, pressure sensors, flow sensors, and oil sensors in the coming years. Sensors are placed strategically throughout a production plant to ensure real-time data monitoring and alarms.
Asia Pacific Oil & Gas Sensors Market Revenue and Forecast to 2031 (US$ Million)
Asia Pacific Oil & Gas Sensors Market Segmentation
Based on type, the Asia Pacific oil & gas sensors market is segmented pressure sensor, temperature sensor, flow sensor, and level sensor. The pressure sensor segment held the largest market share in 2023.
In terms of connectivity, the Asia Pacific oil & gas sensors market is bifurcated into wired and wireless. The wired segment held a larger market share in 2023.
By function, the Asia Pacific oil & gas sensors market is segmented into remote monitoring, condition monitoring and maintenance, analysis and simulation, and others. The remote monitoring segment held the largest market share in 2023.
By application, the Asia Pacific oil & gas sensors market is segmented into upstream, midstream, and downstream. The upstream segment held the largest market share in 2023.
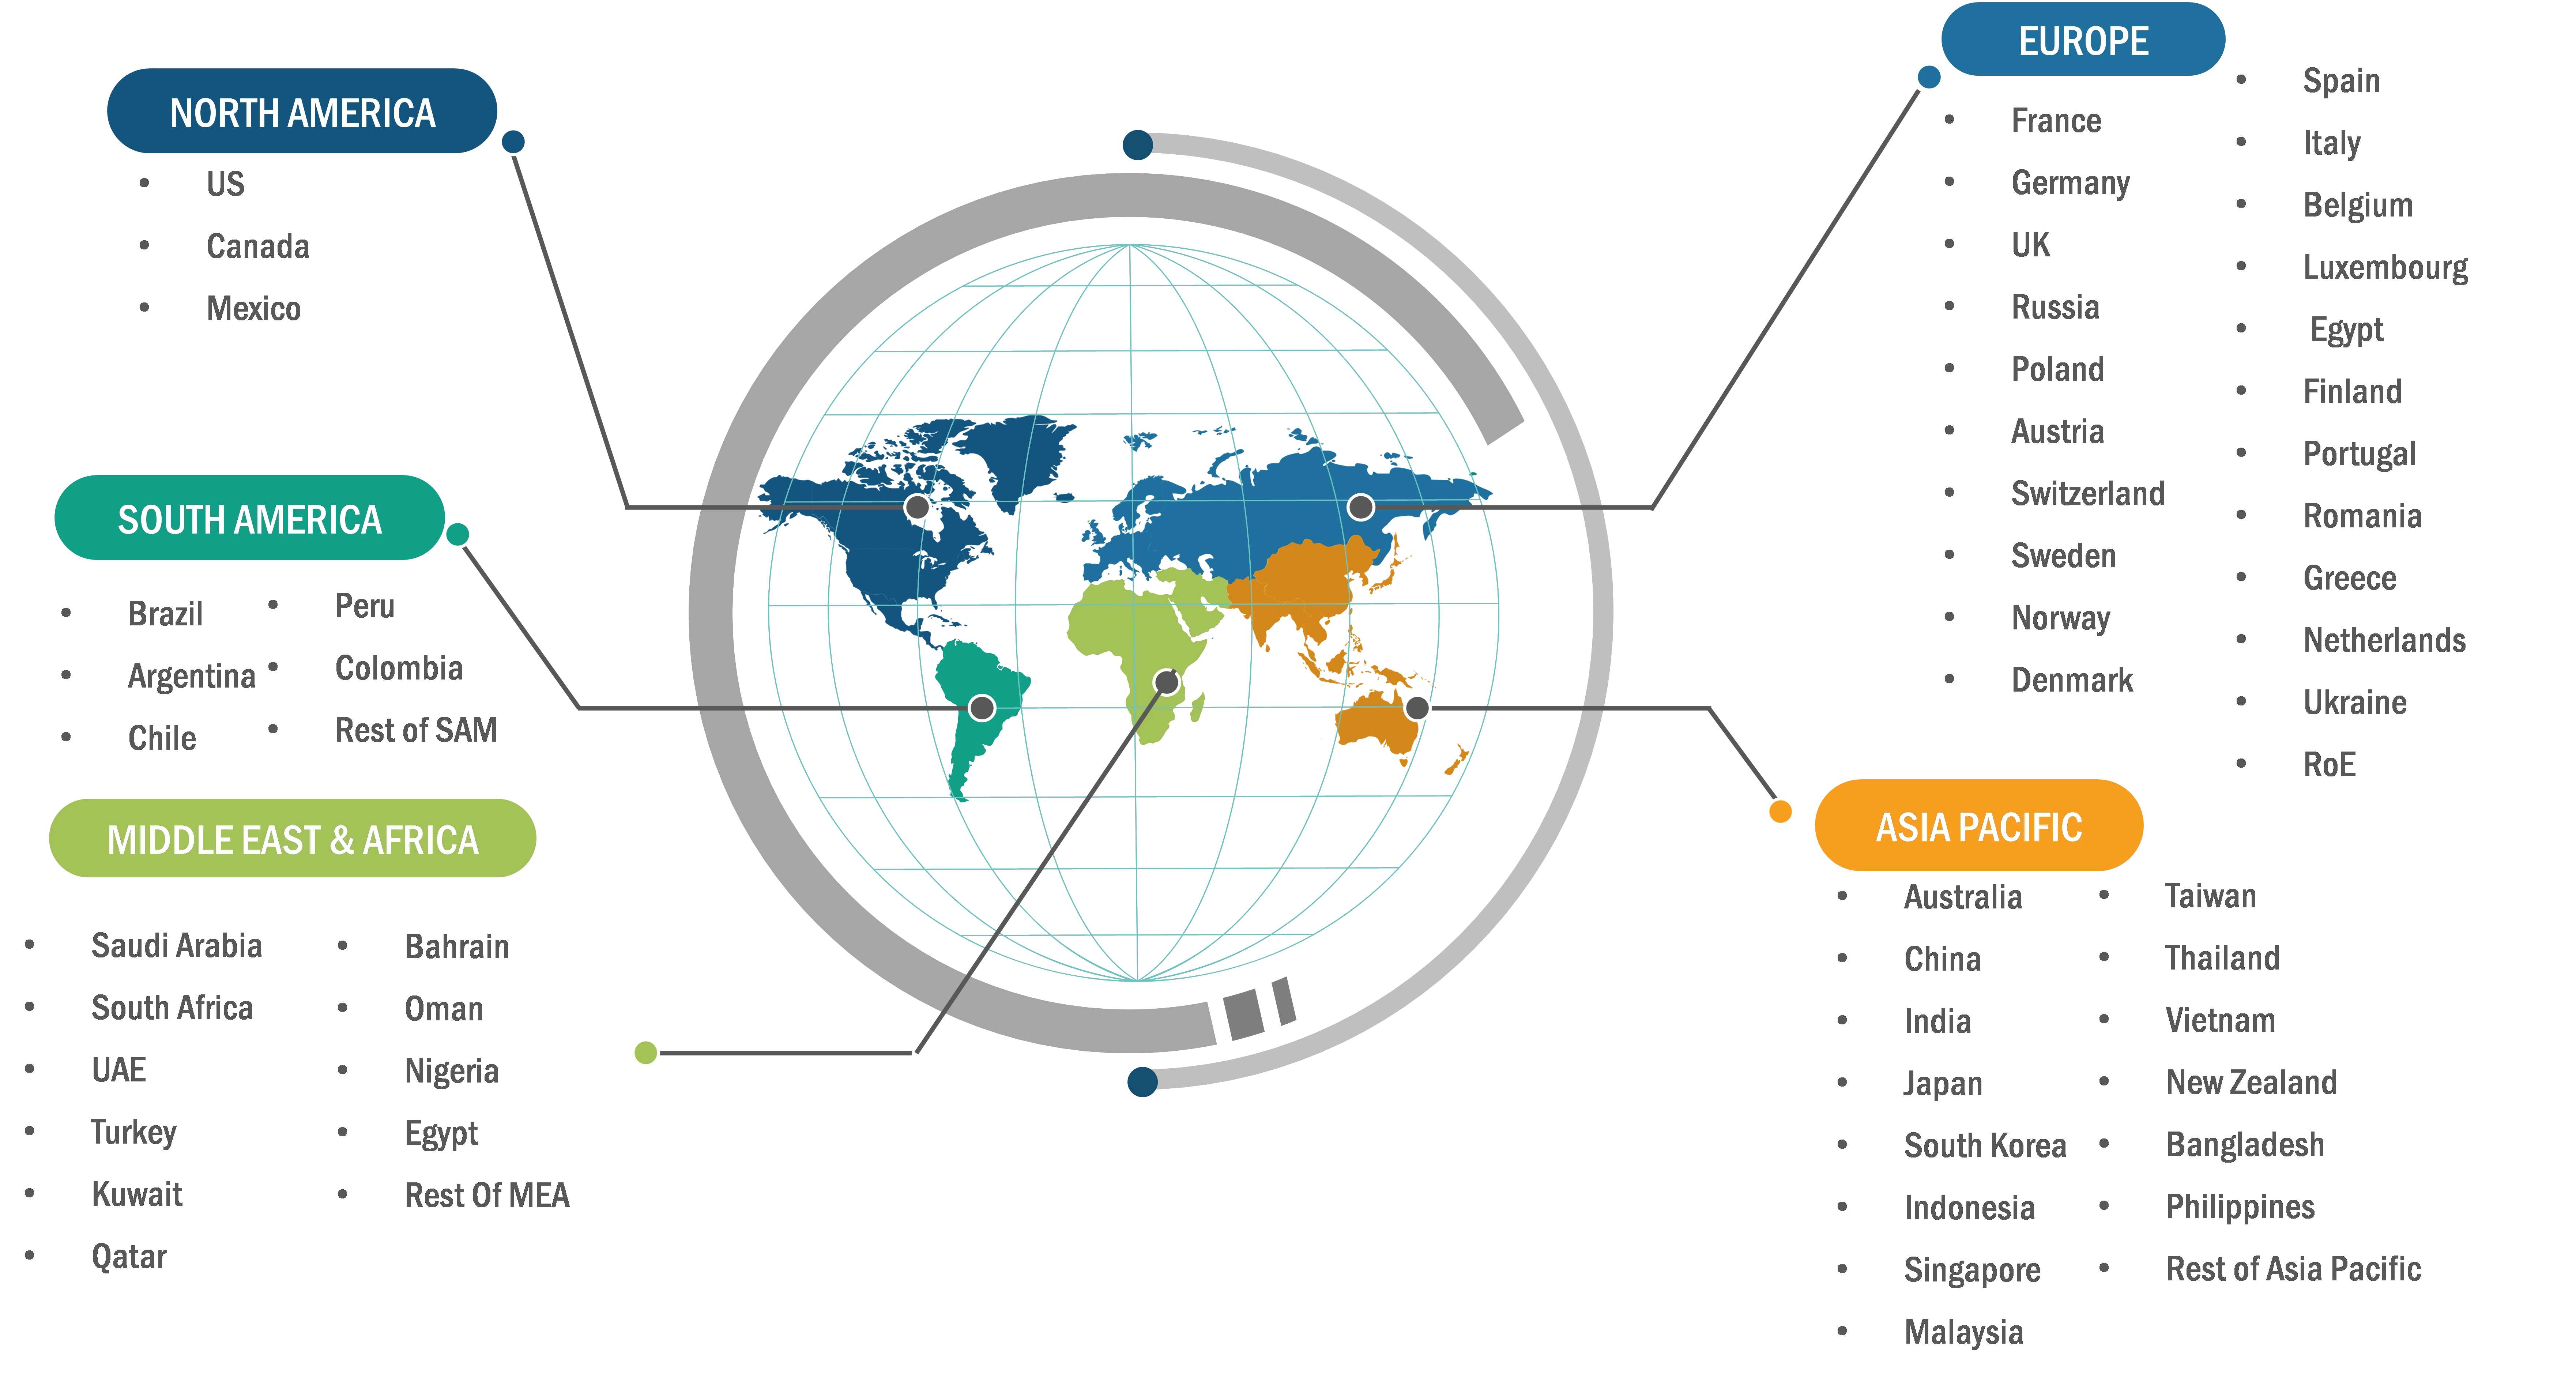
By country, the Asia Pacific oil & gas sensors market is segmented into India, China, Japan, South Korea, Australia, and the Rest of Asia Pacific. China dominated the Asia Pacific oil & gas sensors market share in 2023.
Honeywell International Inc, TE Connectivity Ltd, Robert Bosch GmbH, ABB Ltd, Siemens AG, Rockwell Automation Inc, Analog Devices Inc, Emerson Electric Co, SKF AB, and GE Vernova are some of the leading companies operating in the Asia Pacific oil & gas sensors market.
Asia Pacific Oil & Gas Sensors Market Strategic Insights
Get more information on this report
Asia Pacific Oil & Gas Sensors Market Segmentation Analysis
Asia Pacific Oil & Gas Sensors Market Report Highlights
Asia Pacific Oil & Gas Sensors Report Scope
Report Attribute
Details
Market size in 2023
US$ 2,001.22 Million
Market Size by 2031
US$ 3,312.72 Million
CAGR (2023 - 2031)
6.5%
Historical Data
2021-2022
Forecast period
2024-2031
Segments Covered
By Type
Pressure Sensor
Temperature Sensor
Flow Sensor
Level Sensor
By Connectivity
Wired
Wireless
By Function
Remote Monitoring
Condition Monitoring and Maintenance
Analysis and Simulation
By Application
Upstream
Midstream
Downstream
Regions and Countries Covered
Asia-Pacific
China, India, Japan, Australia, Rest of Asia-Pacific
Market leaders and key company profiles
ABB Ltd
Analog Devices Inc
Emerson Electric Co
GE Vernova
Honeywell International Inc
Robert Bosch GmbH
Rockwell Automation Inc
Siemens AG
SKF AB
TE Connectivity Ltd
Get more information on this report
Asia Pacific Oil & Gas Sensors Market Country and Regional Insights
Get more information on this report
Identical Market Reports with other Region/Countries
The List of Companies - Asia Pacific Oil & Gas Sensors Market
ABB Ltd Analog Devices Inc Emerson Electric Co GE Vernova Honeywell International Inc Robert Bosch GmbH Rockwell Automation Inc Siemens AG SKF AB TE Connectivity Ltd
Frequently Asked Questions
How big is the Asia Pacific Oil & Gas Sensors Market?
The Asia Pacific Oil & Gas Sensors Market is valued at US$ 2,001.22 Million in 2023, it is projected to reach US$ 3,312.72 Million by 2031.
What is the CAGR for Asia Pacific Oil & Gas Sensors Market by (2023 - 2031)?
As per our report Asia Pacific Oil & Gas Sensors Market, the market size is valued at US$ 2,001.22 Million in 2023, projecting it to reach US$ 3,312.72 Million by 2031. This translates to a CAGR of approximately 6.5% during the forecast period.
What segments are covered in this report?
The Asia Pacific Oil & Gas Sensors Market report typically cover these key segments-
Type (Pressure Sensor, Temperature Sensor, Flow Sensor, Level Sensor)
Connectivity (Wired, Wireless)
Function (Remote Monitoring, Condition Monitoring and Maintenance, Analysis and Simulation)
Application (Upstream, Midstream, Downstream)
What is the historic period, base year, and forecast period taken for Asia Pacific Oil & Gas Sensors Market?
The historic period, base year, and forecast period can vary slightly depending on the specific market research report. However, for the Asia Pacific Oil & Gas Sensors Market report:
Historic Period : 2021-2022
Base Year : 2023
Forecast Period : 2024-2031
Who are the major players in Asia Pacific Oil & Gas Sensors Market?
The Asia Pacific Oil & Gas Sensors Market is populated by several key players, each contributing to its growth and innovation. Some of the major players include:
ABB Ltd
Analog Devices Inc
Emerson Electric Co
GE Vernova
Honeywell International Inc
Robert Bosch GmbH
Rockwell Automation Inc
Siemens AG
SKF AB
TE Connectivity Ltd
Who should buy this report?
The Asia Pacific Oil & Gas Sensors Market report is valuable for diverse stakeholders, including:
Investors: Provides insights for investment decisions pertaining to market growth, companies, or industry insights. Helps assess market attractiveness and potential returns.
Industry Players: Offers competitive intelligence, market sizing, and trend analysis to inform strategic planning, product development, and sales strategies.
Suppliers and Manufacturers: Helps understand market demand for components, materials, and services related to concerned industry.
Researchers and Consultants: Provides data and analysis for academic research, consulting projects, and market studies.
Financial Institutions: Helps assess risks and opportunities associated with financing or investing in the concerned market.
Essentially, anyone involved in or considering involvement in the Asia Pacific Oil & Gas Sensors Market value chain can benefit from the information contained in a comprehensive market report.


 Get Free Sample For Asia Pacific Oil & Gas Sensors Market


