توقعات سوق ضمان الإيرادات في أفريقيا حتى عام 2030 - التحليل الإقليمي - حسب المكونات (الحلول والخدمات)، والنشر (داخل مقر العمل والقائم على السحابة)، وحجم المنظمة (الشركات الصغيرة والمتوسطة والمؤسسات الكبيرة)، والرأسي (BFSI، الضيافة، الاتصالات، المرافق، و اخرين)

BMIRE00030346 | Pages: 90 | Technology, Media and Telecommunications
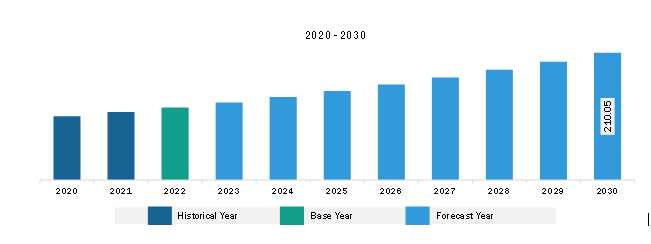
 | Jul 2024 | Type: Regional | Status: Published
بلغت قيمة سوق ضمان الإيرادات في أفريقيا 119.99 مليون دولار أمريكي في عام 2022، ومن المتوقع أن تصل إلى 210.05 مليون دولار أمريكي بحلول عام 2030؛ ومن المقدر أن يسجل معدل نمو سنوي مركب قدره 7.3% من عام 2022 إلى عام 2030.

ارتفاع معدل اختراق الإنترنت يغذي سوق ضمان الإيرادات في أفريقيا

مع استمرار نمو استخدام الإنترنت، تقوم المزيد من الشركات بإجراء عملياتها عبر الإنترنت مما يؤدي إلى زيادة في توليد المعاملات الرقمية وتدفقات الإيرادات. وفقًا لبيانات البنك الدولي، على مستوى العالم، بلغ عدد الأفراد الذين يستخدمون الإنترنت في عام 2021 63%، بزيادة عن 60% في عام 2020. ومع وصول المزيد من الأشخاص إلى الإنترنت، يتم إجراء المزيد من المعاملات الرقمية. يتضمن ذلك عمليات الشراء عبر الإنترنت والمدفوعات الرقمية والأنشطة المالية الأخرى عبر الإنترنت. كلما زاد حجم المعاملات، زادت الحاجة إلى تدابير فعالة لضمان الإيرادات لضمان دقة الفواتير، ومنع تسرب الإيرادات، والكشف عن الأنشطة الاحتيالية. علاوة على ذلك، أدى الارتفاع في انتشار الإنترنت إلى زيادة نمو صناعة التجارة الإلكترونية. تشهد منصات وأسواق البيع بالتجزئة عبر الإنترنت نشاطًا متزايدًا، مع مشاركة المزيد من الشركات والمستهلكين في البيع والشراء عبر الإنترنت. يعد ضمان الإيرادات أمرًا بالغ الأهمية لضمان التعرف الدقيق على الإيرادات وإدارة المخزون ومنع تسرب الإيرادات في التجارة الإلكترونية. هناك زيادة كبيرة في استخدام الإنترنت عبر الهاتف المحمول. مع وصول المزيد من الأشخاص إلى الإنترنت من خلال أجهزتهم المحمولة، هناك حاجة إلى حلول ضمان الإيرادات التي يمكنها مراقبة وإدارة تدفقات الإيرادات من خدمات الهاتف المحمول بشكل فعال، مثل بيانات الهاتف المحمول والمكالمات الصوتية وخدمات القيمة المضافة. ومن ثم، فإن الانتشار المتزايد للإنترنت يعد محركًا مهمًا لسوق ضمان الإيرادات.

نظرة عامة على سوق ضمان الإيرادات في أفريقيا

يعد الارتفاع الكبير في تكنولوجيا الهاتف المحمول أحد العوامل الرئيسية التي تدفع نمو صناعة ضمان الإيرادات في أفريقيا. من المقرر أن تلعب تكنولوجيا الهاتف المحمول دوراً حاسماً في الطريقة التي يعيش بها الناس وتعمل الشركات، مما يتيح حلولاً رقمية جديدة لكل من المؤسسات الكبيرة والصغيرة ويعزز الدعم المتاح للمستهلكين من خلال القنوات الموسعة عبر الإنترنت. لقد نما اعتماد تقنية 4G بشكل ملحوظ في السنوات الأخيرة، ويرجع ذلك أساسًا إلى الطلب المتزايد على السرعات الأعلى، خاصة بين المستهلكين الأصغر سنًا. وفي السنوات الخمس المقبلة، من المتوقع أن يتضاعف اعتماد شبكات الجيل الرابع في منطقة جنوب الصحراء الكبرى في أفريقيا، ليصل معدل انتشارها إلى 45%. ويكتسب الزخم لنشر شبكات الجيل الخامس أيضًا زخمًا، مع التركيز الأولي على المناطق الحضرية والمواقع الصناعية مع زيادة الطلب على الاتصال المتقدم. ومن المتوقع أن يساهم إدخال تقنية الجيل الخامس بمبلغ 11 مليار دولار أمريكي في اقتصاد منطقة جنوب الصحراء الكبرى بحلول عام 2030، وهو ما يمثل أكثر من 6% من التأثير الاقتصادي الإجمالي لصناعة الهاتف المحمول.

إيرادات سوق ضمان الإيرادات في أفريقيا وتوقعاتها حتى عام 2030 (مليون دولار أمريكي)

تجزئة سوق ضمان الإيرادات في أفريقيا

يتم تصنيف سوق ضمان الإيرادات في أفريقيا إلى مكونات ونشر وتنظيم الحجم والعمودي والبلد.

استنادًا إلى المكون، ينقسم سوق ضمان الإيرادات في أفريقيا إلى حلول وخدمات. استحوذ قطاع الحلول على حصة سوقية أكبر في عام 2022.

استنادًا إلى النشر، ينقسم سوق ضمان الإيرادات في أفريقيا إلى محلي وقائم على السحابة. استحوذ القطاع القائم على السحابة على حصة سوقية أكبر في عام 2022.

استنادًا إلى حجم المنظمة، ينقسم سوق ضمان الإيرادات في أفريقيا إلى شركات صغيرة ومتوسطة ومؤسسات كبيرة. استحوذ قطاع المؤسسات الكبيرة على حصة سوقية أكبر في عام 2022.

استنادًا إلى القطاع الرأسي، يتم تصنيف سوق ضمان الإيرادات في أفريقيا إلى BFSI، والضيافة، والاتصالات، والمرافق، وغيرها. استحوذ قطاع الاتصالات على أكبر حصة سوقية في عام 2022.

حسب البلد، ينقسم سوق ضمان الإيرادات في أفريقيا إلى شمال أفريقيا، وغرب أفريقيا، وجنوب أفريقيا، وشرق أفريقيا، ووسط أفريقيا. سيطرت شمال أفريقيا على حصة سوق ضمان الإيرادات في أفريقيا في عام 2022.

تعد Nokia Corp وTata Consultancy Services Ltd وAmdocs وBDO South Africa Inc وAraxxe SAS وPanamax Inc وAdapt IT Holding Proprietary Ltd بعضًا من الشركات الرائدة. الشركات العاملة في سوق ضمان الإيرادات في أفريقيا.

TABLE OF CONTENTS


1. Introduction

1.1 The Insight Partners Research Report Guidance

1.2 Market Segmentation

2. Executive Summary

2.1 Key Insights

2.2 Market Attractiveness

3. Research Methodology

3.1 Coverage

3.2 Secondary Research

3.3 Primary Research

4. Africa Revenue Assurance Market Landscape

4.1 Overview

4.2 PEST Analysis

4.3 Ecosystem Analysis

4.3.1 Solution Providers:

4.3.2 Service Providers

4.3.3 End Users:

4.3.4 List of Vendors in the Value Chain

5. Africa Revenue Assurance Market - Key Market Dynamics

5.1 Drivers

5.1.1 Rise in Internet Penetration

5.1.2 Favorable Business Environment

5.2 Restraints

5.2.1 Lack of Awareness and Understanding of Revenue Assurance

5.2.2 Organizational Management Issues

5.3 Opportunity

5.3.1 Rapid Evolution of Digital Technologies

5.4 Future Trends

5.4.1 Growing Importance of Revenue Assurance in Non-Telecom Sectors

5.5 Impact of Drivers and Restraints:

6. Revenue Assurance Market - Africa Market Analysis

6.1 Revenue Assurance Market Revenue (US$ Million), 2020-2030

6.2 Revenue Assurance Market Forecast Analysis

7. Africa Revenue Assurance Market Analysis - by Component

7.1 Solution

7.1.1 Overview

7.1.2 Solution: Revenue Assurance Market - Revenue and Forecast to 2030 (US$ Million)

7.2 Services

7.2.1 Overview

7.2.2 Services: Revenue Assurance Market - Revenue and Forecast to 2030 (US$ Million)

8. Africa Revenue Assurance Market Analysis - by Deployment

8.1 On-premise

8.1.1 Overview

8.1.2 On-premise: Revenue Assurance Market - Revenue and Forecast to 2030 (US$ Million)

8.2 Cloud-based

8.2.1 Overview

8.2.2 Cloud-based: Revenue Assurance Market - Revenue and Forecast to 2030 (US$ Million)

9. Africa Revenue Assurance Market Analysis - by Organization Size

9.1 SMEs

9.1.1 Overview

9.1.2 SMEs: Revenue Assurance Market - Revenue and Forecast to 2030 (US$ Million)

9.2 Large Enterprises

9.2.1 Overview

9.2.2 Large Enterprises: Revenue Assurance Market - Revenue and Forecast to 2030 (US$ Million)

10. Africa Revenue Assurance Market Analysis - by Vertical

10.1 BFSI

10.1.1 Overview

10.1.2 BFSI: Revenue Assurance Market - Revenue and Forecast to 2030 (US$ Million)

10.2 Hospitality

10.2.1 Overview

10.2.2 Hospitality: Revenue Assurance Market - Revenue and Forecast to 2030 (US$ Million)

10.3 Telecom

10.3.1 Overview

10.3.2 Telecom: Revenue Assurance Market - Revenue and Forecast to 2030 (US$ Million)

10.4 Utilities

10.4.1 Overview

10.4.2 Utilities: Revenue Assurance Market - Revenue and Forecast to 2030 (US$ Million)

10.5 Others

10.5.1 Overview

10.5.2 Others: Revenue Assurance Market - Revenue and Forecast to 2030 (US$ Million)

11. Africa Revenue Assurance Market - Country Analysis

11.1 Africa Revenue Assurance Market Overview

11.1.1 Africa: Revenue Assurance Market - Revenue and Forecast Analysis - by Country

11.1.1.1 Africa: Revenue Assurance Market - Revenue and Forecast Analysis - by Country

11.1.1.2 Northern Africa: Revenue Assurance Market - Revenue and Forecast to 2030 (US$ Million)

11.1.1.2.1 Northern Africa: Revenue Assurance Market Breakdown, by Component

11.1.1.2.2 Northern Africa: Revenue Assurance Market Breakdown, by Deployment

11.1.1.2.3 Northern Africa: Revenue Assurance Market Breakdown, by Organization Size

11.1.1.2.4 Northern Africa: Revenue Assurance Market Breakdown, by Vertical

11.1.1.3 Western Africa: Revenue Assurance Market - Revenue and Forecast to 2030 (US$ Million)

11.1.1.3.1 Western Africa: Revenue Assurance Market Breakdown, by Component

11.1.1.3.2 Western Africa: Revenue Assurance Market Breakdown, by Deployment

11.1.1.3.3 Western Africa: Revenue Assurance Market Breakdown, by Organization Size

11.1.1.3.4 Western Africa: Revenue Assurance Market Breakdown, by Vertical

11.1.1.4 Southern Africa: Revenue Assurance Market - Revenue and Forecast to 2030 (US$ Million)

11.1.1.4.1 Southern Africa: Revenue Assurance Market Breakdown, by Component

11.1.1.4.2 Southern Africa: Revenue Assurance Market Breakdown, by Deployment

11.1.1.4.3 Southern Africa: Revenue Assurance Market Breakdown, by Organization Size

11.1.1.4.4 Southern Africa: Revenue Assurance Market Breakdown, by Vertical

11.1.1.5 Eastern Africa: Revenue Assurance Market - Revenue and Forecast to 2030 (US$ Million)

11.1.1.5.1 Eastern Africa: Revenue Assurance Market Breakdown, by Component

11.1.1.5.2 Eastern Africa: Revenue Assurance Market Breakdown, by Deployment

11.1.1.5.3 Eastern Africa: Revenue Assurance Market Breakdown, by Organization Size

11.1.1.5.4 Eastern Africa: Revenue Assurance Market Breakdown, by Vertical

11.1.1.6 Central Africa: Revenue Assurance Market - Revenue and Forecast to 2030 (US$ Million)

11.1.1.6.1 Central Africa: Revenue Assurance Market Breakdown, by Component

11.1.1.6.2 Central Africa: Revenue Assurance Market Breakdown, by Deployment

11.1.1.6.3 Central Africa: Revenue Assurance Market Breakdown, by Organization Size

11.1.1.6.4 Central Africa: Revenue Assurance Market Breakdown, by Vertical

12. Competitive Landscape

12.1 Heat Map Analysis by Key Players

12.2 Company Positioning & Concentration

13. Industry Landscape

13.1 Overview

13.2 Market Initiative

13.3 Mergers & Acquisitions

14. Company Profiles

14.1 Nokia Corp

14.1.1 Key Facts

14.1.2 Business Description

14.1.3 Products and Services

14.1.4 Financial Overview

14.1.5 SWOT Analysis

14.1.6 Key Developments

14.2 Tata Consultancy Services Ltd

14.2.1 Key Facts

14.2.2 Business Description

14.2.3 Products and Services

14.2.4 Financial Overview

14.2.5 SWOT Analysis

14.2.6 Key Developments

14.3 Amdocs Ltd

14.3.1 Key Facts

14.3.2 Business Description

14.3.3 Products and Services

14.3.4 Financial Overview

14.3.5 SWOT Analysis

14.3.6 Key Developments

14.4 Araxxe SAS

14.4.1 Key Facts

14.4.2 Business Description

14.4.3 Products and Services

14.4.4 Financial Overview

14.4.5 SWOT Analysis

14.4.6 Key Developments

14.5 BDO South Africa Inc

14.5.1 Key Facts

14.5.2 Business Description

14.5.3 Products and Services

14.5.4 Financial Overview

14.5.5 SWOT Analysis

14.5.6 Key Developments

14.6 Panamax Inc

14.6.1 Key Facts

14.6.2 Business Description

14.6.3 Products and Services

14.6.4 Financial Overview

14.6.5 SWOT Analysis

14.6.6 Key Developments

14.7 Adapt IT Holdings Proprietary Ltd

14.7.1 Key Facts

14.7.2 Business Description

14.7.3 Products and Services

14.7.4 Financial Overview

14.7.5 SWOT Analysis

14.7.6 Key Developments

15. Appendix

15.1 About The Insight Partners

15.2 Word Index

List of Tables

Table 1. Revenue Assurance Market Segmentation

Table 2. List of Vendors

Table 3. Revenue Assurance Market - Revenue and Forecast to 2030 (US$ Million)

Table 4. Revenue Assurance Market - Revenue and Forecast to 2030 (US$ Million) - by Component

Table 5. Revenue Assurance Market - Revenue and Forecast to 2030 (US$ Million) - by Deployment

Table 6. Revenue Assurance Market - Revenue and Forecast to 2030 (US$ Million) - by Organization Size

Table 7. Revenue Assurance Market - Revenue and Forecast to 2030 (US$ Million) - by Vertical

Table 8. Africa: Revenue Assurance Market - Revenue and Forecast to 2030 (US$ Million) - by Country

Table 9. Northern Africa: Revenue Assurance Market - Revenue and Forecast to 2030 (US$ Million) - by Component

Table 10. Northern Africa: Revenue Assurance Market - Revenue and Forecast to 2030 (US$ Million) - by Deployment

Table 11. Northern Africa: Revenue Assurance Market - Revenue and Forecast to 2030 (US$ Million) - by Organization Size

Table 12. Northern Africa: Revenue Assurance Market - Revenue and Forecast to 2030 (US$ Million) - by Vertical

Table 13. Western Africa: Revenue Assurance Market - Revenue and Forecast to 2030 (US$ Million) - by Component

Table 14. Western Africa: Revenue Assurance Market - Revenue and Forecast to 2030 (US$ Million) - by Deployment

Table 15. Western Africa: Revenue Assurance Market - Revenue and Forecast to 2030 (US$ Million) - by Organization Size

Table 16. Western Africa: Revenue Assurance Market - Revenue and Forecast to 2030 (US$ Million) - by Vertical

Table 17. Southern Africa: Revenue Assurance Market - Revenue and Forecast to 2030 (US$ Million) - by Component

Table 18. Southern Africa: Revenue Assurance Market - Revenue and Forecast to 2030 (US$ Million) - by Deployment

Table 19. Southern Africa: Revenue Assurance Market - Revenue and Forecast to 2030 (US$ Million) - by Organization Size

Table 20. Southern Africa: Revenue Assurance Market - Revenue and Forecast to 2030 (US$ Million) - by Vertical

Table 21. Eastern Africa: Revenue Assurance Market - Revenue and Forecast to 2030 (US$ Million) - by Component

Table 22. Eastern Africa: Revenue Assurance Market - Revenue and Forecast to 2030 (US$ Million) - by Deployment

Table 23. Eastern Africa: Revenue Assurance Market - Revenue and Forecast to 2030 (US$ Million) - by Organization Size

Table 24. Eastern Africa: Revenue Assurance Market - Revenue and Forecast to 2030 (US$ Million) - by Vertical

Table 25. Central Africa: Revenue Assurance Market - Revenue and Forecast to 2030 (US$ Million) - by Component

Table 26. Central Africa: Revenue Assurance Market - Revenue and Forecast to 2030 (US$ Million) - by Deployment

Table 27. Central Africa: Revenue Assurance Market - Revenue and Forecast to 2030 (US$ Million) - by Organization Size

Table 28. Central Africa: Revenue Assurance Market - Revenue and Forecast to 2030 (US$ Million) - by Vertical

Table 29. Heat Map Analysis

Table 30. List of Abbreviation

List of Figures

Figure 1. Revenue Assurance Market Segmentation, by Regions

Figure 2. PEST Analysis

Figure 3. Ecosystem Analysis

Figure 4. Revenue Assurance Market - Key Market Dynamics

Figure 5. Impact Analysis of Drivers and Restraints

Figure 6. Revenue Assurance Market Revenue (US$ Million), 2020-2030

Figure 7. Revenue Assurance Market Share (%) - by Component (2022 and 2030)

Figure 8. Solution: Revenue Assurance Market - Revenue and Forecast to 2030 (US$ Million)

Figure 9. Services: Revenue Assurance Market - Revenue and Forecast to 2030 (US$ Million)

Figure 10. Revenue Assurance Market Share (%) - by Deployment (2022 and 2030)

Figure 11. On-premise: Revenue Assurance Market - Revenue and Forecast to 2030 (US$ Million)

Figure 12. Cloud-based: Revenue Assurance Market - Revenue and Forecast to 2030 (US$ Million)

Figure 13. Revenue Assurance Market Share (%) - by Organization Size (2022 and 2030)

Figure 14. SMEs: Revenue Assurance Market - Revenue and Forecast to 2030 (US$ Million)

Figure 15. Large Enterprises: Revenue Assurance Market - Revenue and Forecast to 2030 (US$ Million)

Figure 16. Revenue Assurance Market Share (%) - by Vertical (2022 and 2030)

Figure 17. BFSI: Revenue Assurance Market - Revenue and Forecast to 2030 (US$ Million)

Figure 18. Hospitality: Revenue Assurance Market - Revenue and Forecast to 2030 (US$ Million)

Figure 19. Telecom: Revenue Assurance Market - Revenue and Forecast to 2030 (US$ Million)

Figure 20. Utilities: Revenue Assurance Market - Revenue and Forecast to 2030 (US$ Million)

Figure 21. Others: Revenue Assurance Market - Revenue and Forecast to 2030 (US$ Million)

Figure 22. Africa: Revenue Assurance Market, by Key Regions - Revenue (2022) (US$ Million)

Figure 23. Africa: Revenue Assurance Market Breakdown, by Key Countries, 2022 and 2030 (%)

Figure 24. Northern Africa: Revenue Assurance Market - Revenue and Forecast to 2030 (US$ Million)

Figure 25. Western Africa: Revenue Assurance Market - Revenue and Forecast to 2030 (US$ Million)

Figure 26. Southern Africa: Revenue Assurance Market - Revenue and Forecast to 2030 (US$ Million)

Figure 27. Eastern Africa: Revenue Assurance Market - Revenue and Forecast to 2030 (US$ Million)

Figure 28. Central Africa: Revenue Assurance Market - Revenue and Forecast to 2030 (US$ Million)

Figure 29. Company Positioning & Concentration

1. Nokia Corp 
2. Tata Consultancy Services Ltd 
3. Amdocs 
4. Araxxe SAS 
5. BDO South Africa Inc 
6. Panamax Inc 
7. Adapt IT Holdings Proprietary Ltd 

  • Save and reduce time carrying out entry-level research by identifying the growth, size, leading players, and segments in the Africa revenue assurance market.
  • Highlights key business priorities in order to assist companies to realign their business strategies.
  • The key findings and recommendations highlight crucial progressive industry trends in the Africa revenue assurance market, thereby allowing players across the value chain to develop effective long-term strategies.
  • Develop/modify business expansion plans by using substantial growth offering developed and emerging markets.
  • Scrutinize in-depth Africa market trends and outlook coupled with the factors driving the Africa revenue assurance market, as well as those hindering it.
  • Enhance the decision-making process by understanding the strategies that underpin commercial interest with respect to client products, segmentation, pricing, and distribution.
Report Code
Full Name
Country Name
Email Id
Phone Number
Job Title
Company
Requirement

Note : Your data will never be shared with third parties, however, we may send you information from time to time about our products that may be of interest to you. By submitting your details, you agree to be contacted by us. You may contact us at any time to opt-out.


Purchase Options
Single User License
$3550
$2840
Site License
$4550
$3640
Enterprise License
$5550
$4440